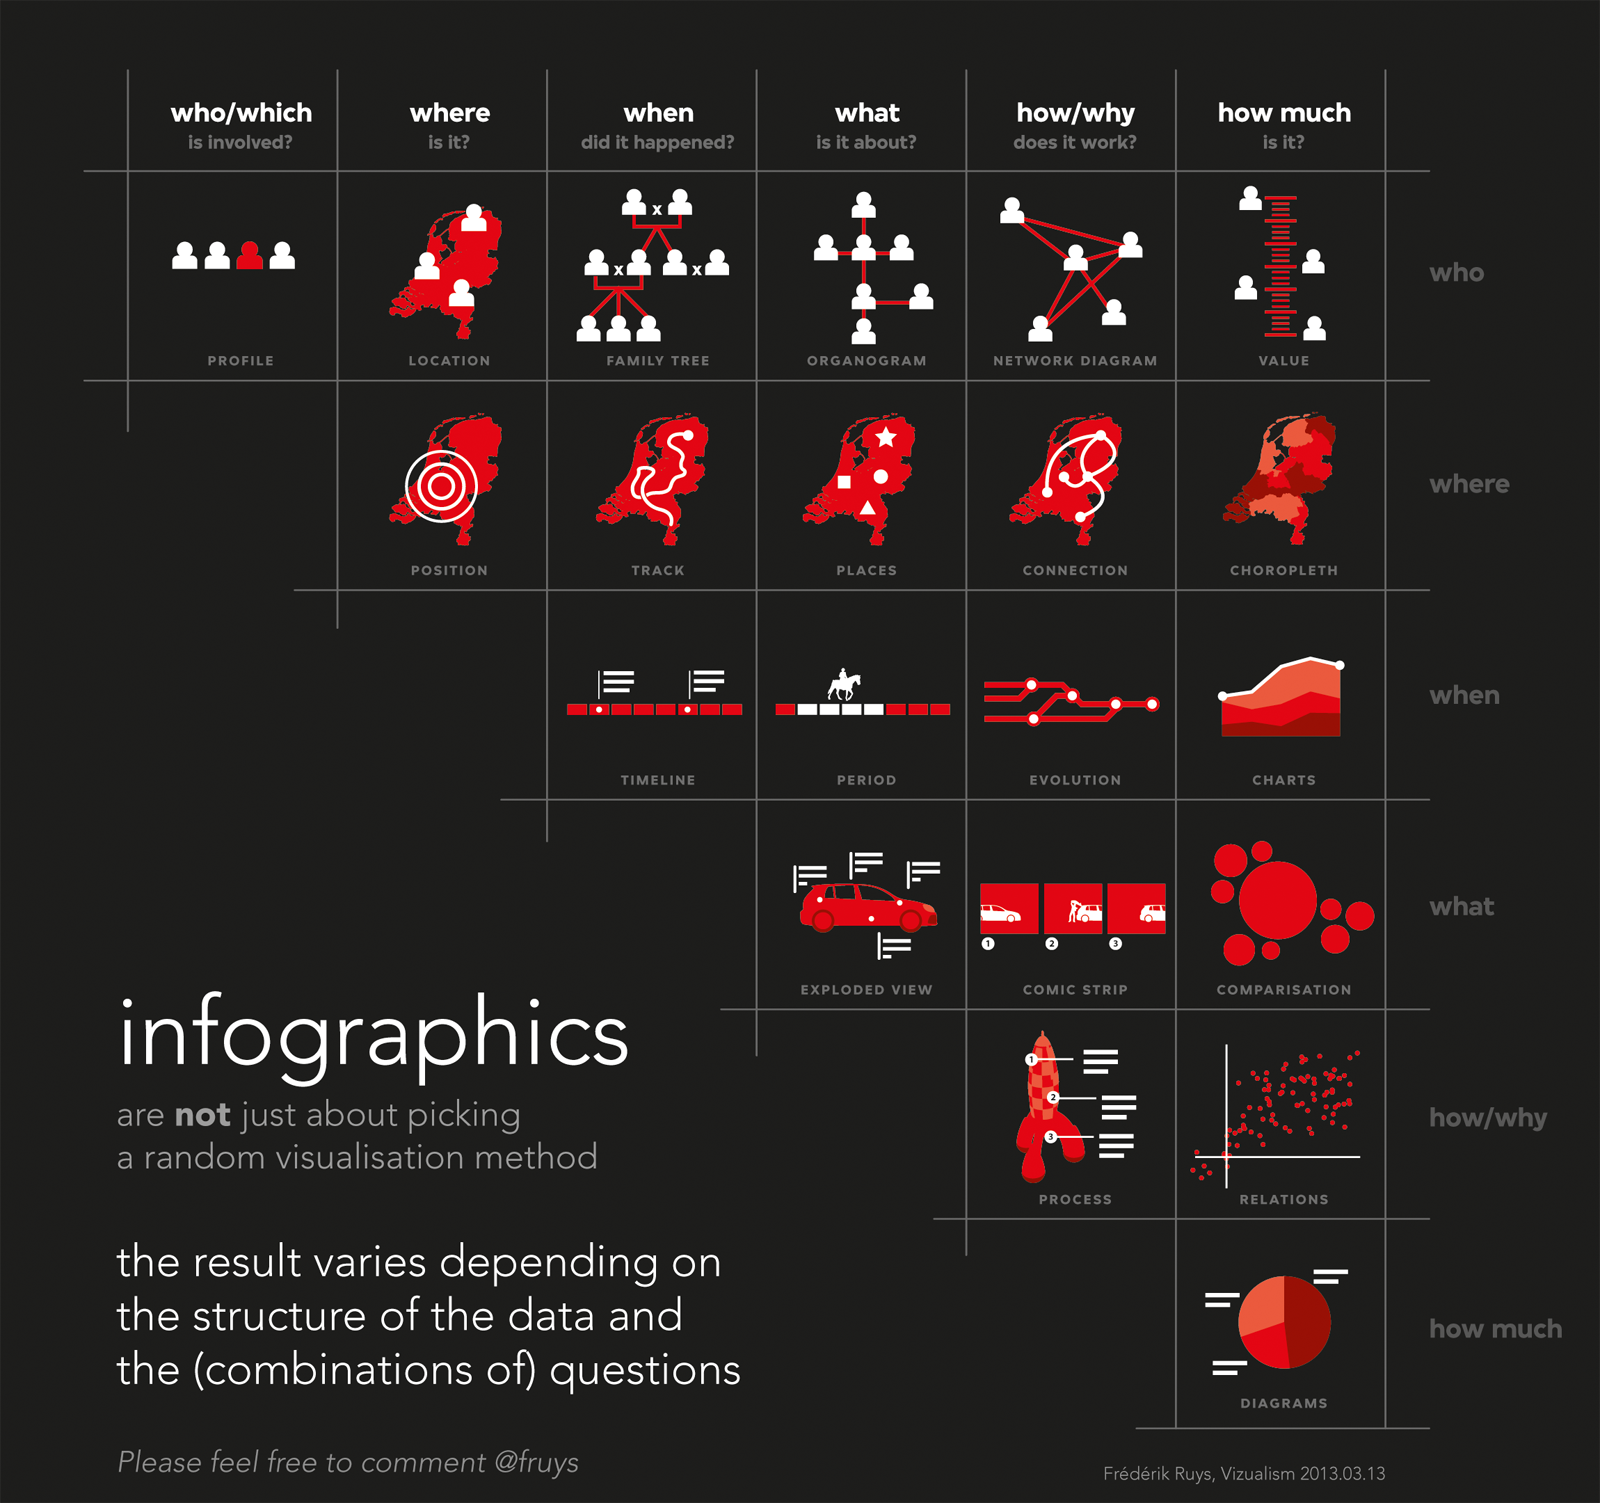
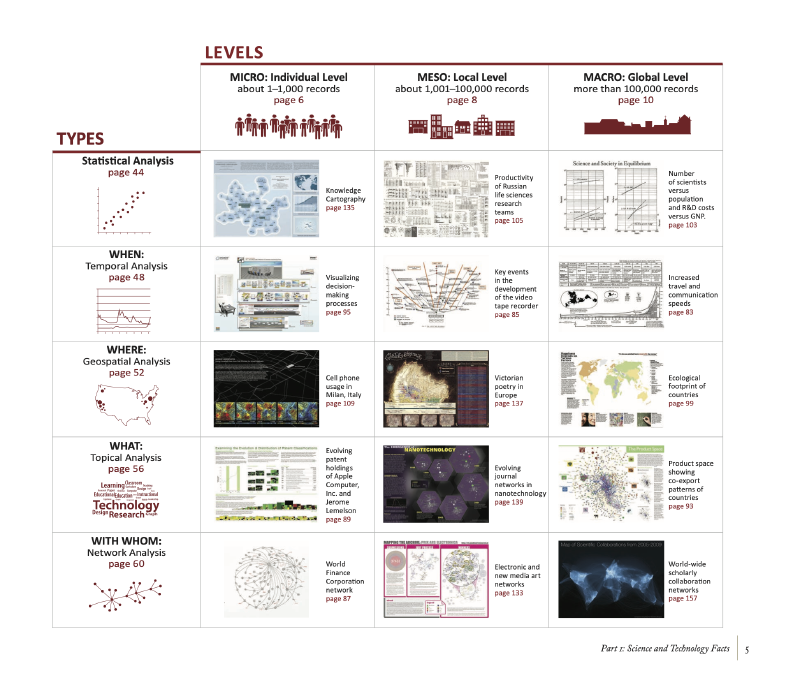
Avatar

Visualizing.JP

データ可視化にまつわる実践的な手法や実例を紹介しています。

  1. トップ
  2. 検索
  3. 記事一覧
  4. チャート・カタログ
  5. 見るための記事
  6. 教えるための記事
  7. 作るための記事
  8. データ可視化の原理
  9. イベント
  10. リンク
  11. このサイトについて

    1. Infographic Taxonomy
    2. Different Types of Analysis
Featured image of post データ・タイプ別チャート分類
チャート・カタログ

データ・タイプ別チャート分類

Aug 28, 2020

データ・タイプ別チャート分類です(後日追記します)。

Infographic Taxonomy

Infographic Taxonomy

Different Types of Analysis

Atlas Of Knowledge by Katy Borner

Licensed under CC BY-NC-SA 4.0
Oct 22, 2025 22:33 +0900

Featured image of post 3D散布図

3D散布図

Featured image of post バブル・チャート

バブル・チャート

Featured image of post レンジ・プロット

レンジ・プロット

Featured image of post ワニの口チャート ― 日本財政を象徴する独自の比喩的可視化

ワニの口チャート ― 日本財政を象徴する独自の比喩的可視化

Featured image of post 三次元 円筒座標 散布図

三次元 円筒座標 散布図

© 2013 - 2025 Yuichi Yazaki