ディシメトリック・マップ(Dasymetric Map)の事例を紹介します。
リスボンの人口密度。コロプレス(左)とディシメトリック(右)。
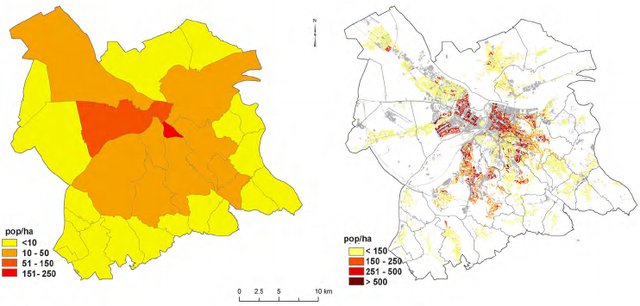
https://www.arcgis.com/apps/Cascade/index.html?appid=fde9d5cc2716490faf1e861d171a6fdd
ウィーン市の人口密度。コロプレス(前者)とディシメトリック(後者)。
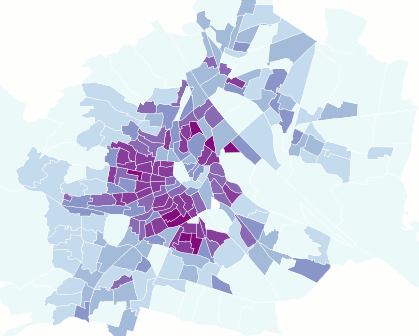
GIFアニメーションで切り替わるように処理されている画像
https://anitagraser.com/2012/11/18/improving-population-density-maps-using-dasymetric-mapping/
ベオグラード市のデータを対象にした研究
(PDF) Dasymetric modelling of population dynamics in urban areas
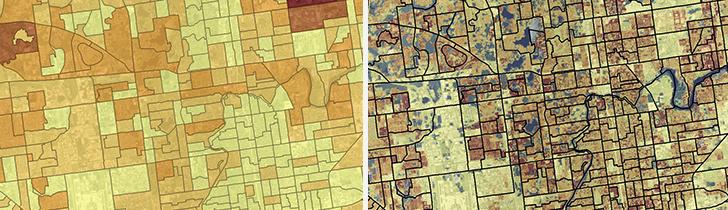
フロリダ州タンパにおけるコロプレス・マップ(左)とディシメトリック・マップ(右)の比較
https://www.epa.gov/enviroatlas/dasymetric-toolbox
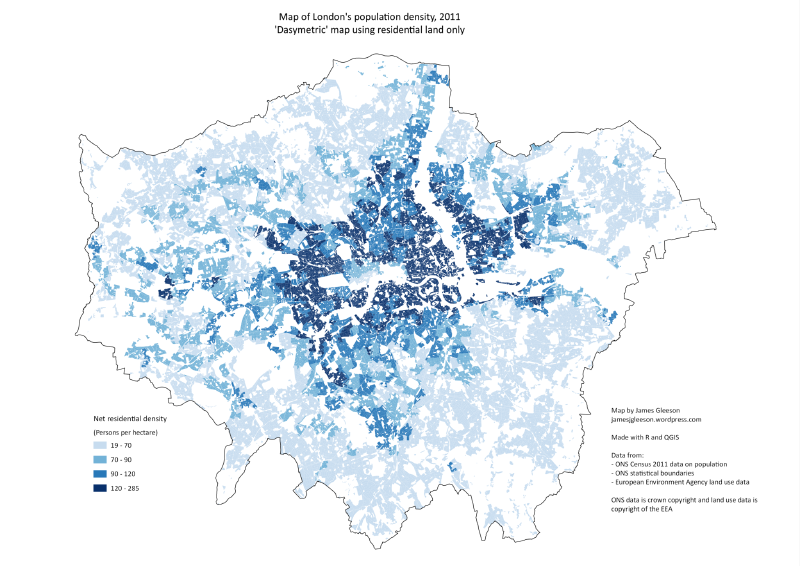
2011年 ロンドンの人口密度

Dasymetric map of London’s population density, 2011 – James Gleeson
人口密度のマッピング。国勢調査データと土地被覆の統合
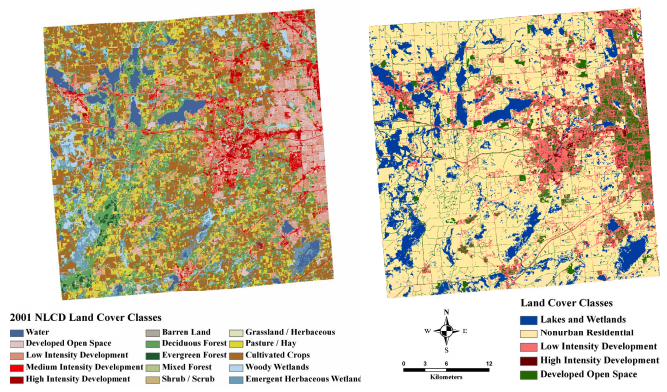
http://sites.tufts.edu/gis/files/2013/02/Nelson_Jason.pdf
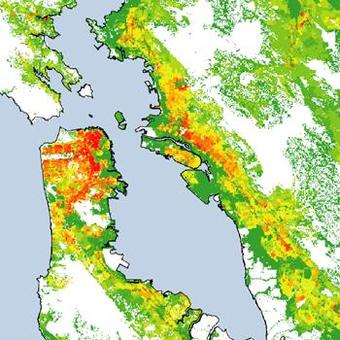
サンフランシスコ・ベイエリアの地図
以前の似た作例
Henry Drury Harness (1838)
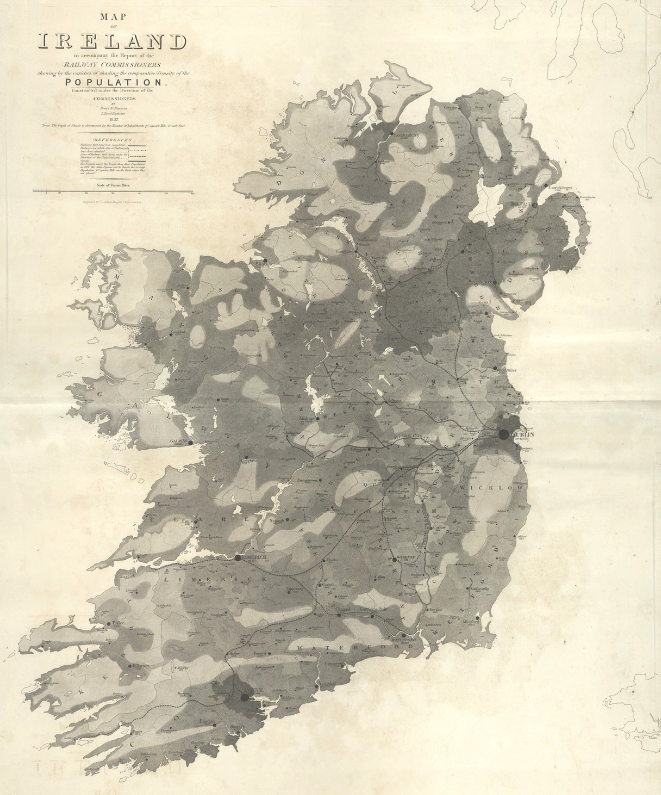
https://digital.ucd.ie/view-media/ivrla:45724/bookView#40a90816-2189-4a97-8c09-bb6c3ebf5c2b http://www.complexcity.info/files/2011/06/harness-1837-flowmap.pdf