
DATA VISUALIZATION NOTES · SINCE 2013
Practical methods and examples around data visualization.

LATEST · 2026.11.07
Waiting for the First Woman's Name: Reading a Scene from A Sort of Joy
Data Feminism describes a scene from A Sort of Joy (2015) in which first names of artists are read aloud and the audience waits more than three minutes for the first woman's name. This article checks that description against primary sources.
SERIES
Classics of Data Visualization
Playfair's pie charts, Minard's map, statistical bureaus' thematic maps, Tukey's paper. Reading the charts and ideas that shaped today's forms of visualization.
 William Playfair
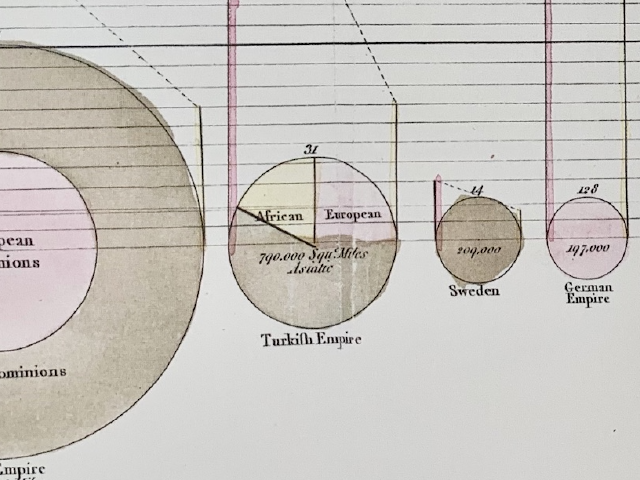
Extent as Circles, Taxes as Dotted Lines: Playfair's Breviary
 William Playfair
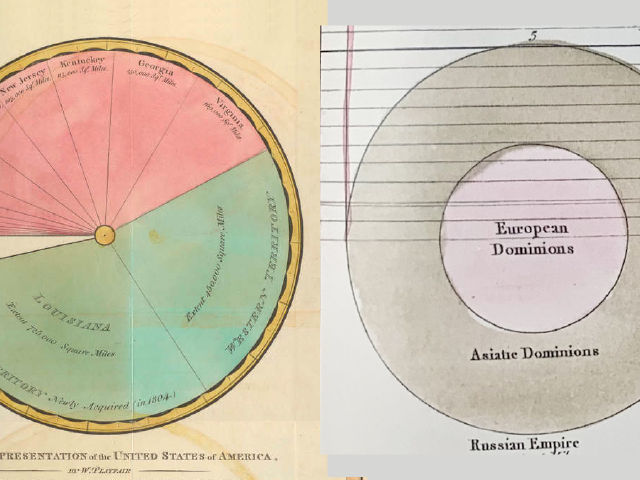
Circle Area and Sector Angle: Playfair, 1801 and 1805
 William Playfair
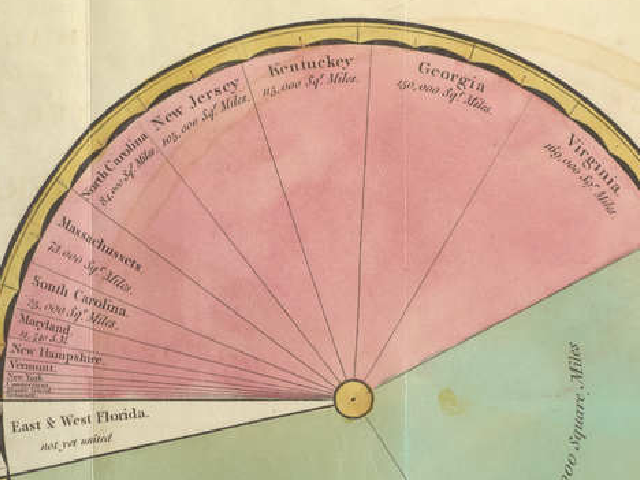
Dividing the Size of the U.S. into Sectors: Playfair, 1805
 Elizabeth Palmer Peabody
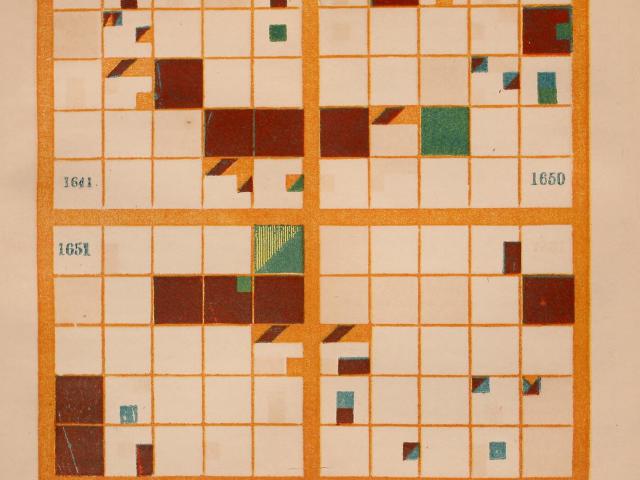
Painting One Year in Nine Cells: Peabody's Chronological Charts, 1856
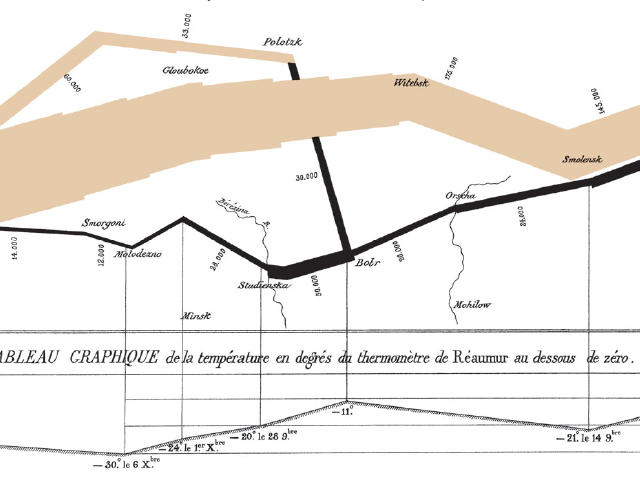 Charles Joseph Minard
10,000 Men per Millimeter: Minard's Russia Campaign and Hannibal Charts
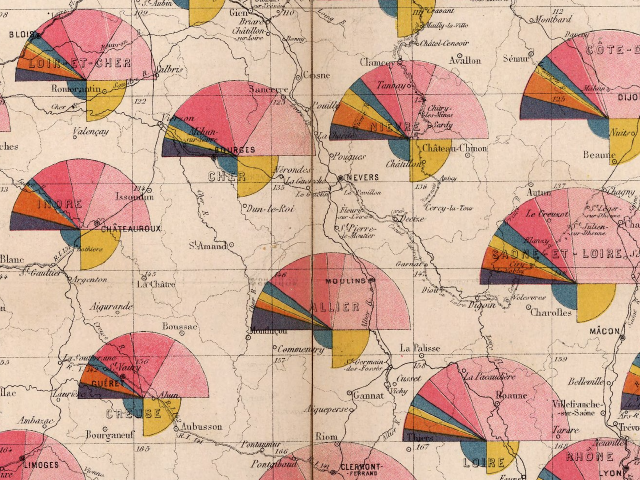 French Ministry of Public Works, Cartography and Drawing Bureau
Semicircles for Length, Quarter-Circles for Density: 1880 Routes Map
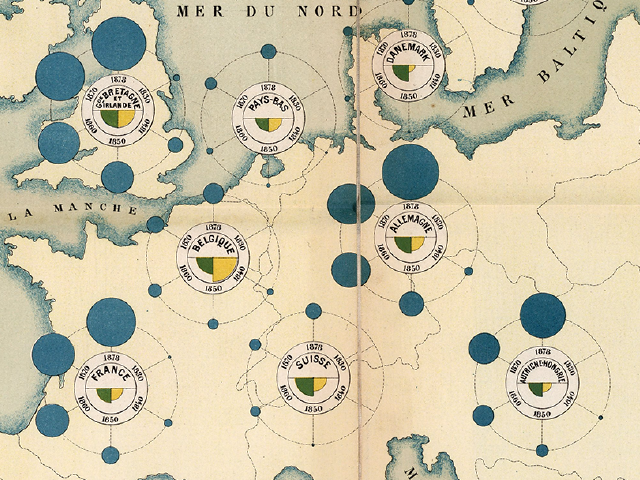 French Ministry of Public Works (Émile Cheysson)
Year Circles Around a Country: The 1880 Railway Development Map
 Sugi Kōji, Mori Ōgai, and Imai Takeo
Settling on the Word for Statistics: The Meiji Translation Debate
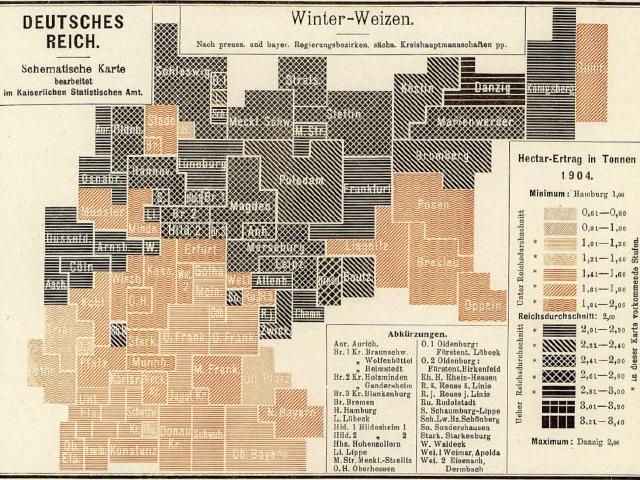 Imperial Statistical Office of the German Empire
Switching Inks at the Average: Wheat-Yield Map of the 1904 Harvest
 John W. Tukey
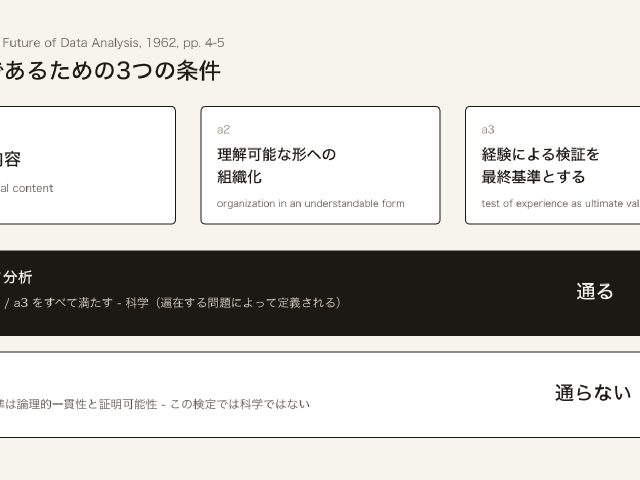
Data Analysis Is a Science: Tukey, 1962
 Allan Pred
A Merchant's Day as a Single Line: Pred's Boston Space-Time Path
SERIES
Data Visualization × Journalism
Reading reports entered for the Sigma Awards for data journalism, and a data-driven film, to learn how their visualizations were made: wind roses, satellite images, ship tracks, floods, heat, price maps, and stacked war dead.
 Simon Scarr, Manas Sharma, and Marco Hernandez (Reuters)
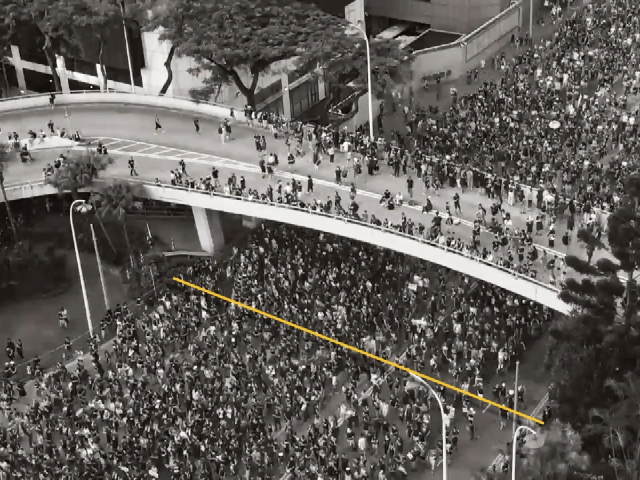
Showing How the Crowd Was Counted: Reuters' Hong Kong Protest
 Robert Lee, Tristan Ahtone, and Margaret Pearce
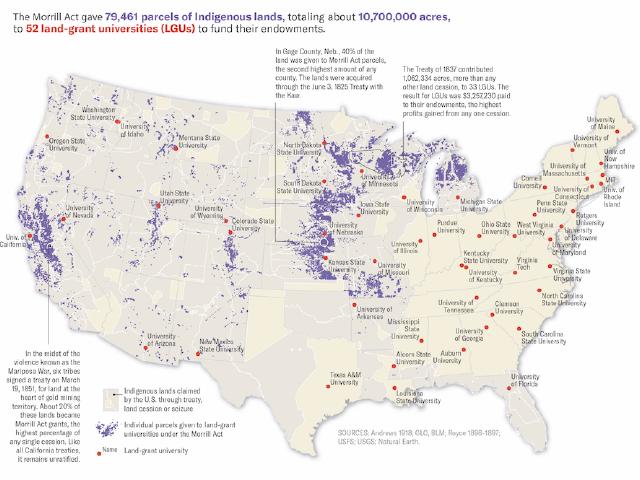
80,000 Parcels Shown at Different Scales: Land-Grab Universities
 TEXTY.org.ua (Nadja Kelm et al.)
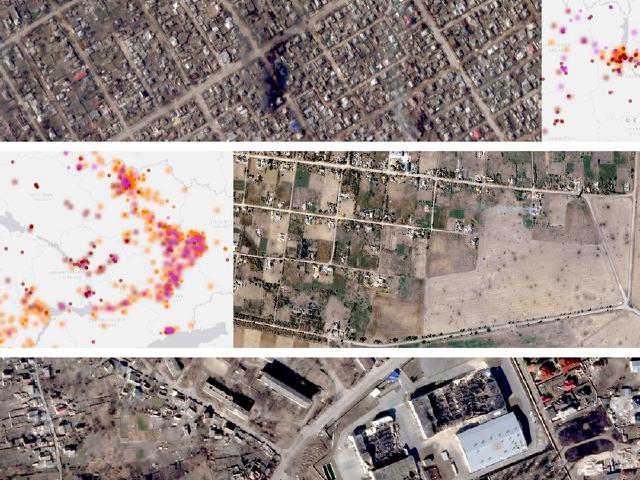
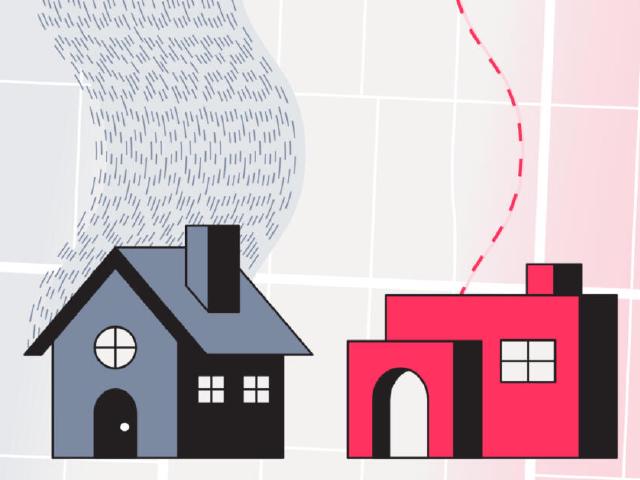
Certain Points Sharp, Uncertain Points Blurred: Under attack
 The Markup (Leon Yin, Aaron Sankin et al.)
Counting Slow Addresses at the Same Price: Still Loading
 Naveena Sadasivam and Clayton Aldern (Grist)
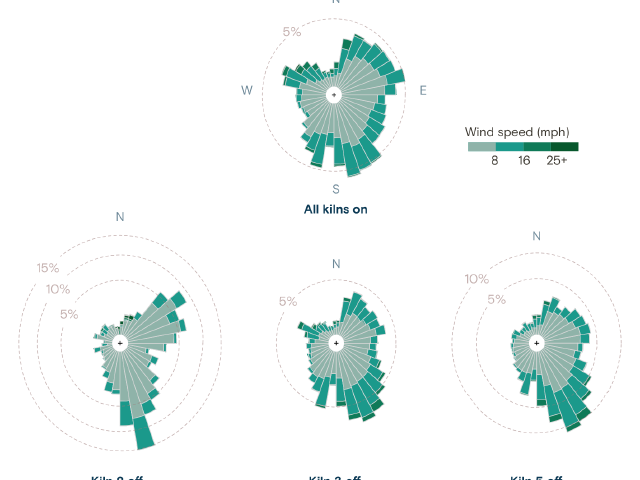
Wind Roses for the Hours the Kilns Stood Idle: Any Way the Wind Blows
 The Reporter
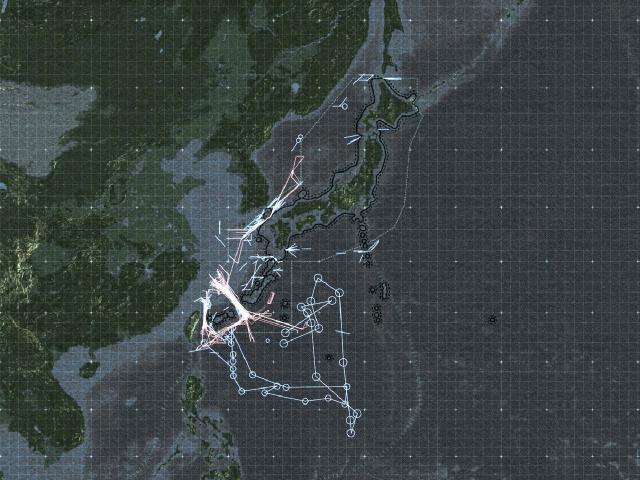
Tracing Track Images Back into a Map: The First Island Chain
 Financial Times
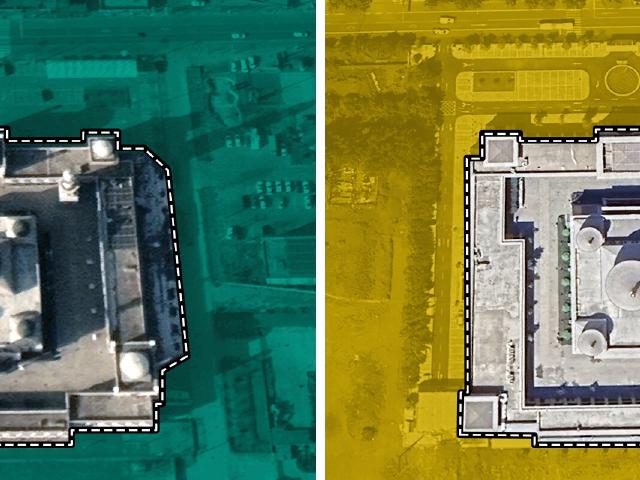
Teal Before, Yellow After: FT's China Mosques Investigation
 Borja Andrino, Luis Sevillano, and Jacob Vicente
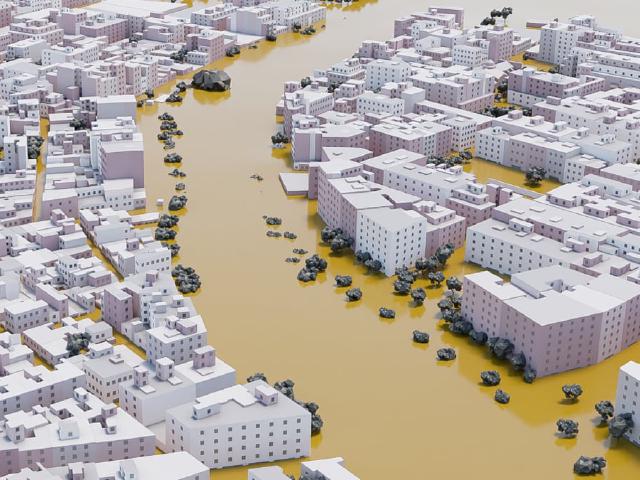
140 Water Marks Become the Town's Water Surface: Paiporta bajo el agua
 The Hindu Data team
69°C on a 36°C Day: Chennai's Heat Index
 Arena for Journalism in Europe, NRK et al.
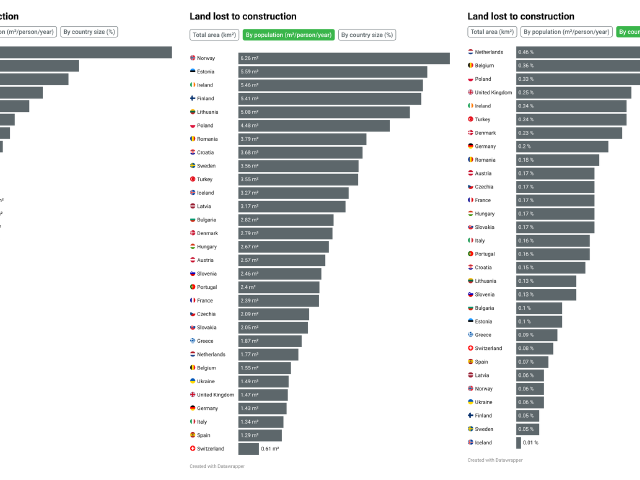
Country Rankings Flip Depending on the Divisor: Green to Grey
 Neil Halloran
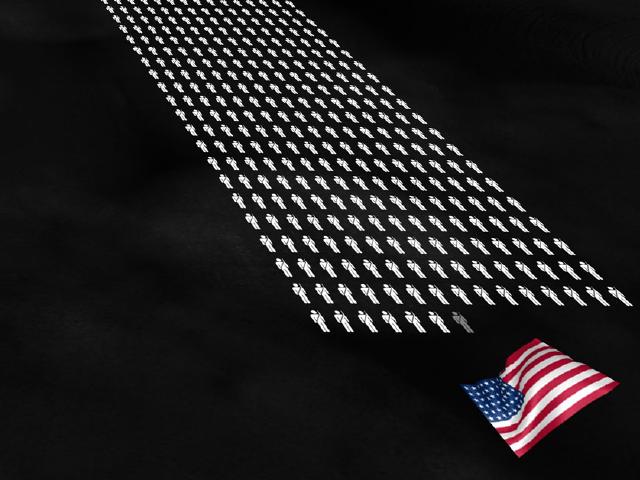
Restacking at 1 Figure = 1,000 People: The Fallen of World War II
 Jan Diehm and Amber Thomas (The Pudding)
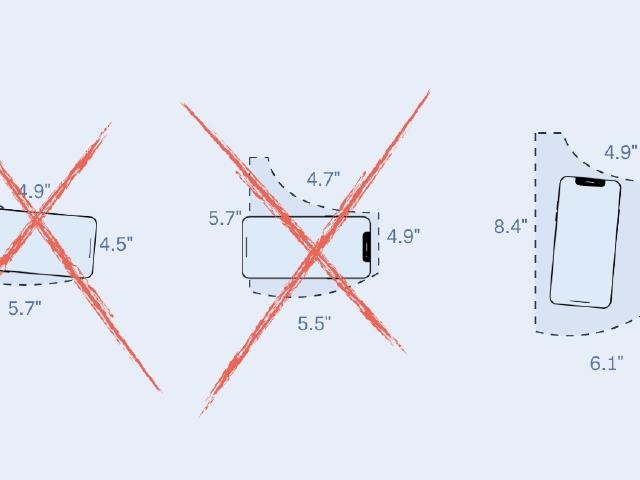
Showing the Gap by Whether a Phone Fits: Women's Pockets are Inferior
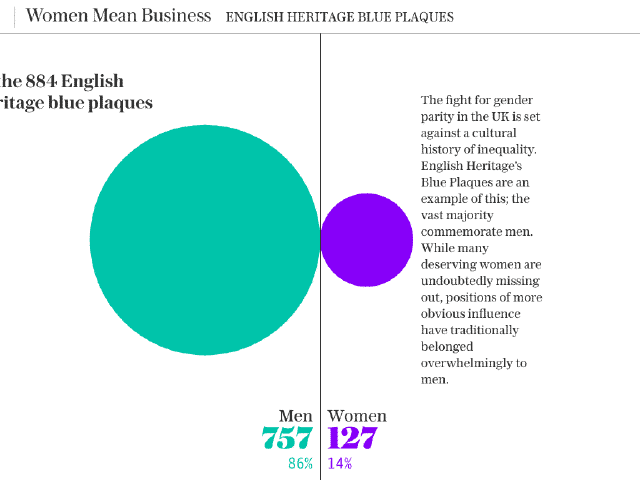 Fraser Lyness et al. (The Telegraph)
Giving Women the Purple That Stands Out on White: The Telegraph's "Born Equal"
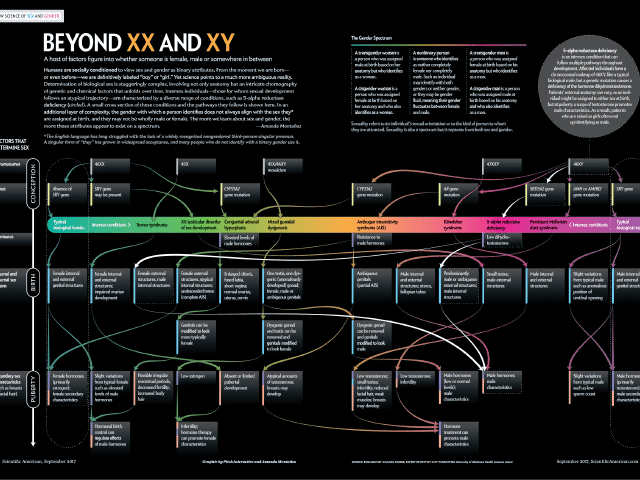 Amanda Montañez, Pitch Interactive
From Frequency to Pathways: Beyond XX and XY
SERIES
Data Visualization × Speculative Design
Reading works by Giorgia Lupi / Accurat and Superflux to see how they turn numbers into evidence people can feel.
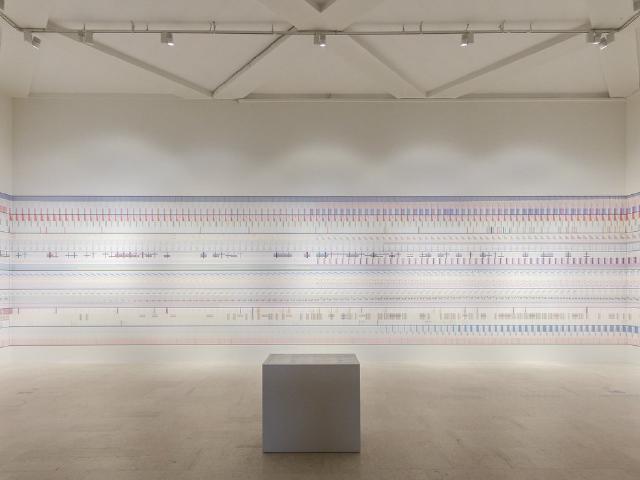 Giorgia Lupi / Accurat
A Pattern from Afar, Data Up Close
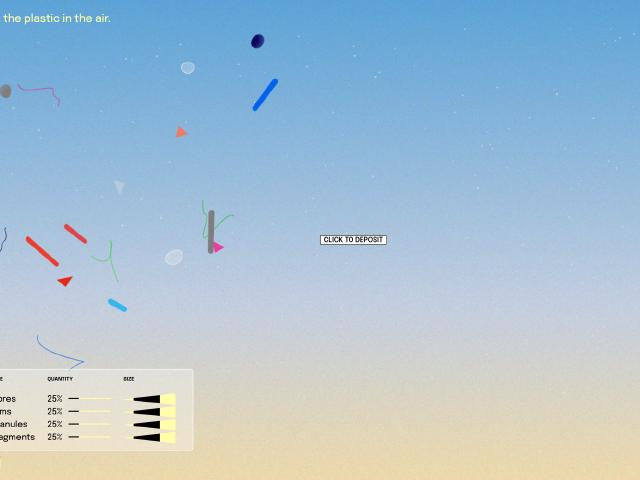 Giorgia Lupi
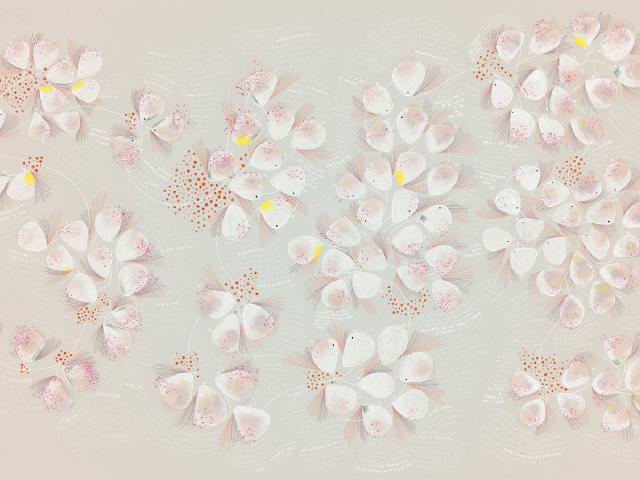
Turning Unmeasurable Air into a Window of Conjecture
 Giorgia Lupi / Kaki King
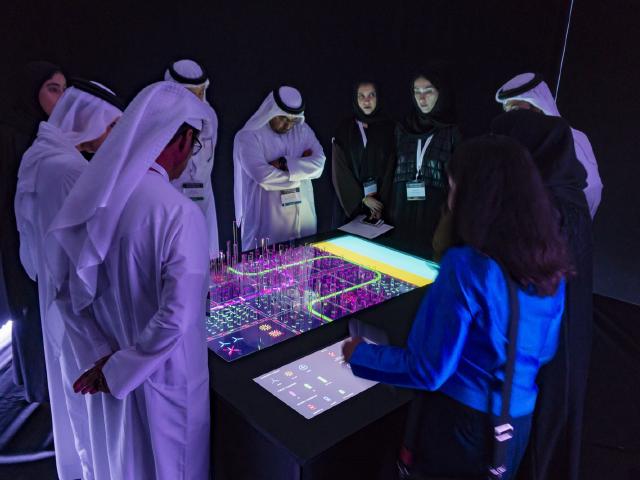
Divided by Test Days, Layering Hope and Fear: Bruises
 Superflux
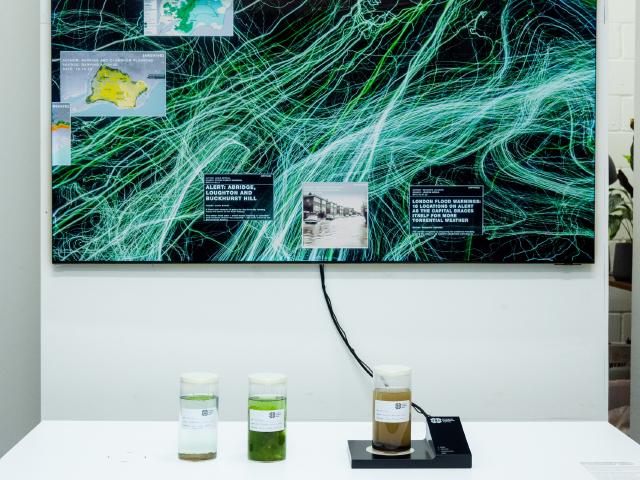
Turning Numbers into Evidence You Can Breathe
 Superflux
An Agency Where the River Speaks in Poems
SERIES
Data Physicalization
Knots, cubes, yarn, paper, beach trash, grains of rice, food. Reading cases that turned data into things you can touch, in chronological order, to learn how numbers are matched to materials.
 Record keepers of ancient West Asia
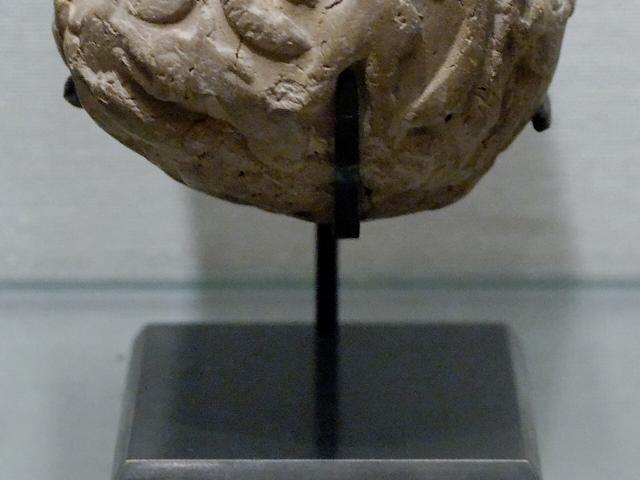
Shape for Item, Count for Quantity, Reportedly: Clay Tokens
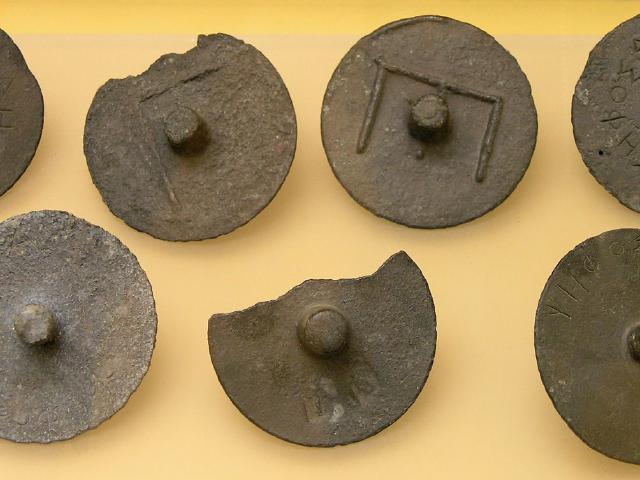 Courts of Ancient Athens
Sorting Votes by Hollow or Solid Stems, Laid on a Board: Pebble Voting
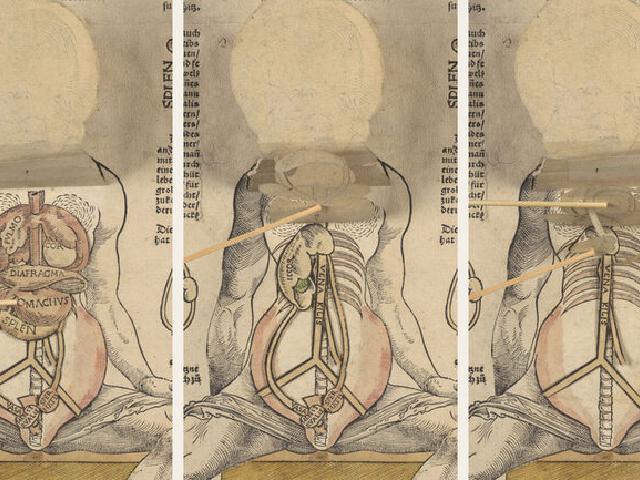 Matthew Paris, Heinrich Vogtherr et al.
Tables on Turning Disks, Bodies in Lifting Flaps: Movable Books
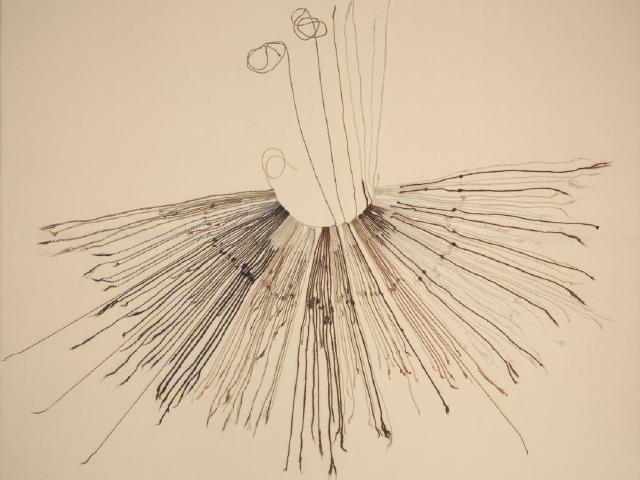 Andean record keepers
Recording Numbers by Knots and Position: The Quipu
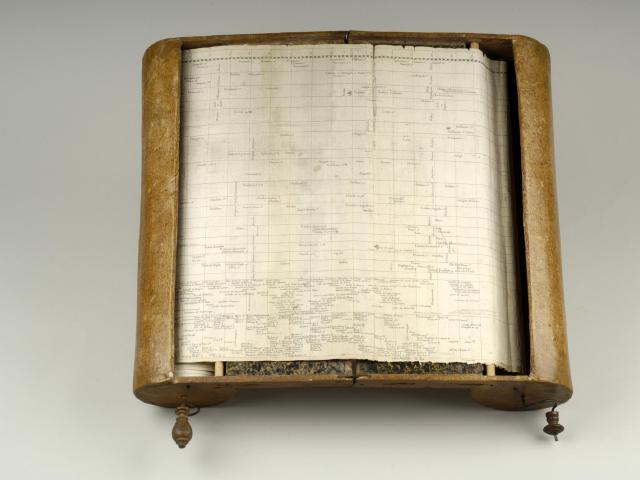 Jacques Barbeu-Dubourg
Winding 6,500 Years at One Scale: Machine chronologique
 Francis Galton
Generating a Distribution by Dropping Balls: The Galton Board
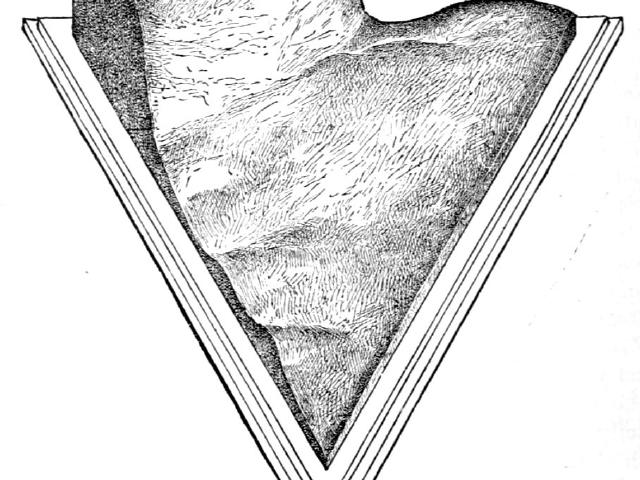 Robert H. Thurston and M. I. Coster
Mix Ratio as a Triangle, Strength as Height: Thurston's Alloy Model
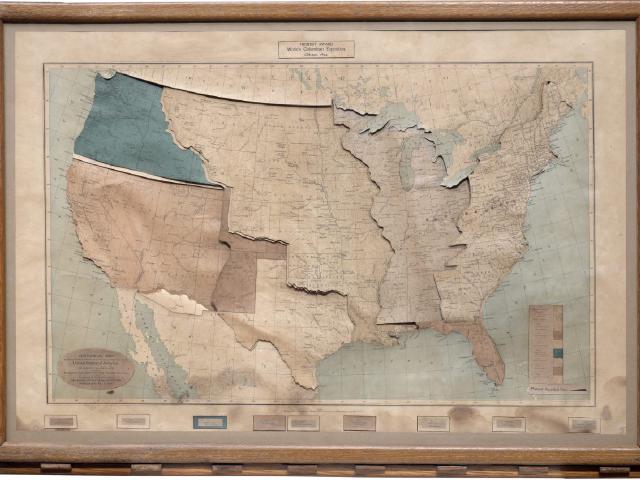 James T. B. Ives
Territory Plates Slide In, Key by Key: Ives's Historical Map
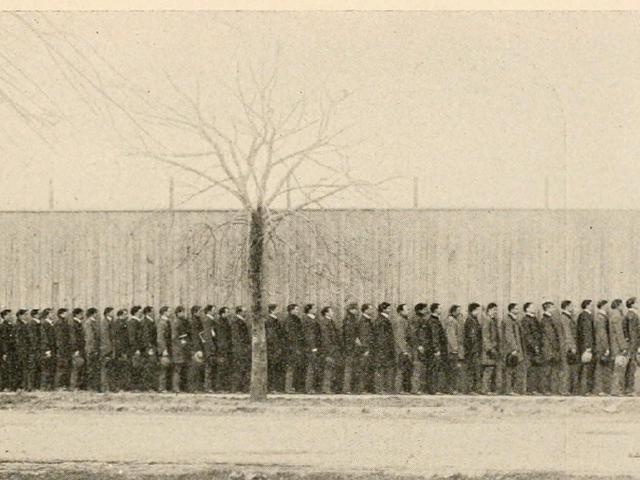 Charles B. Davenport
Rearranged into a Different Graph: Frequency Polygon Without Paper
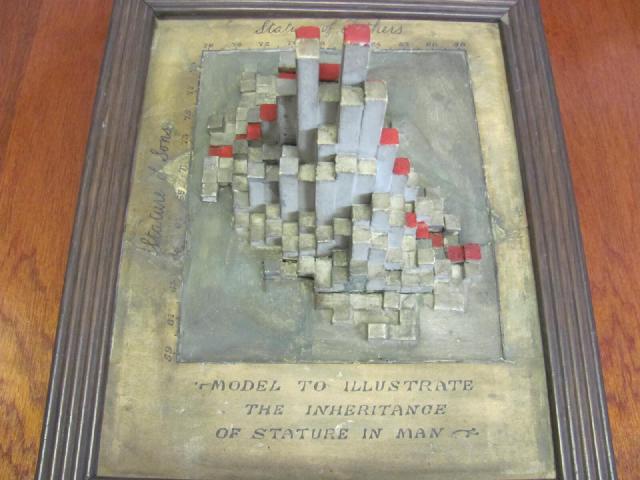 Karl Pearson and Alice Lee
A Frequency Table Stood Up as Columns: The Stature Model
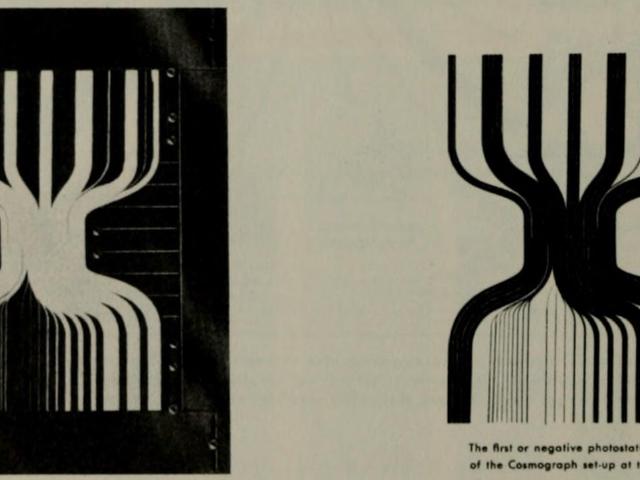 IBM
Counting Paper Strips to Build a Flow Chart: IBM's Cosmograph
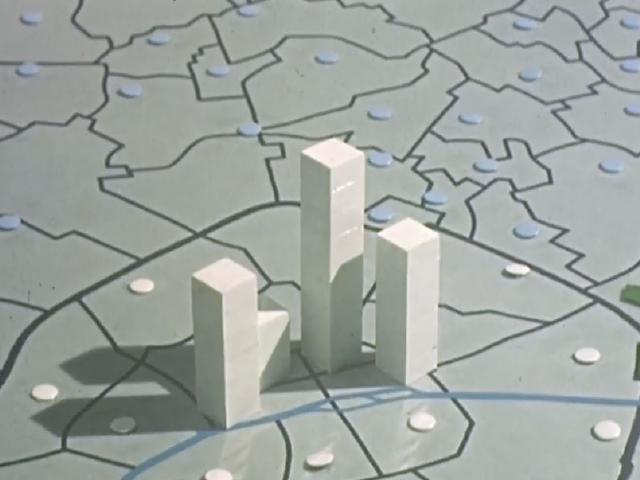 ISHA and CMSS
Filmed in Cubes of 10,000 People: 160 Years of Paris Population
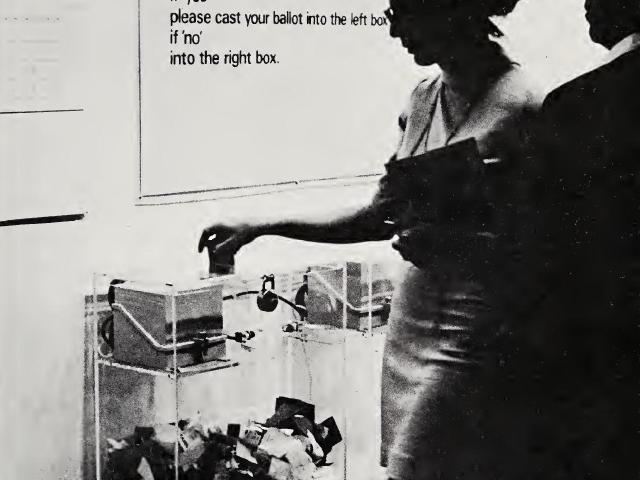 Hans Haacke
Yes and No in Paper Piles and Numbers: MoMA Poll
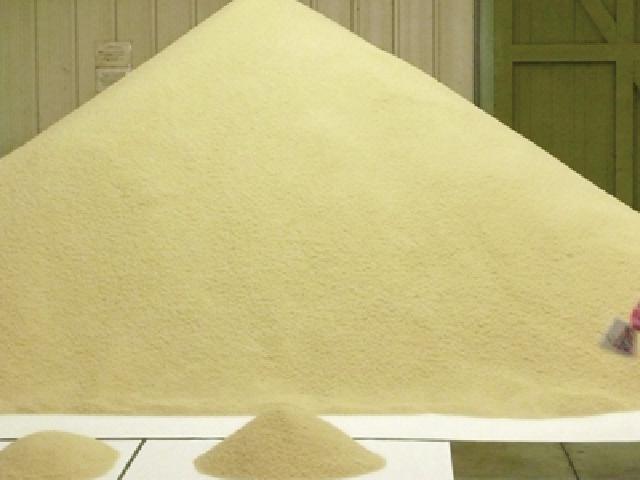 Stan's Cafe (James Yarker)
One Grain of Rice per Person, Weighed Out: Of All The People
SERIES
Data Sonification
Reading works and tools that turn data into sound: which variables they assigned to pitch, duration, timbre, or the number of instruments, and what they left out of the data.
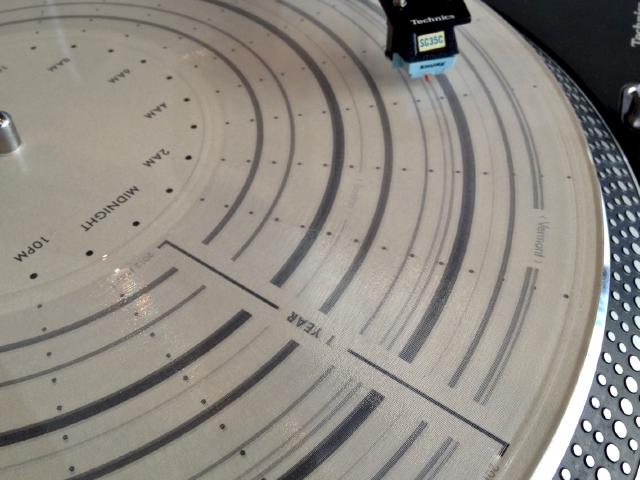 Brian House
One Day per Revolution, Movements Cut into a Record: Quotidian Record
 Brian Foo
Distance as Length, Income as Instrument Count: Two Trains
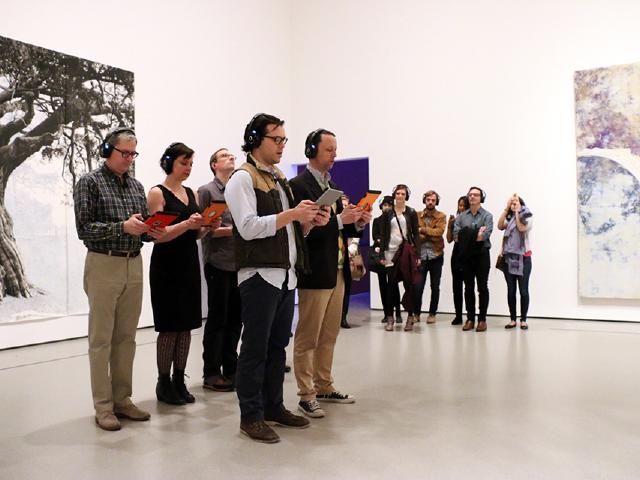 Elevator Repair Service et al.
Waiting for the First Woman's Name: A Sort of Joy
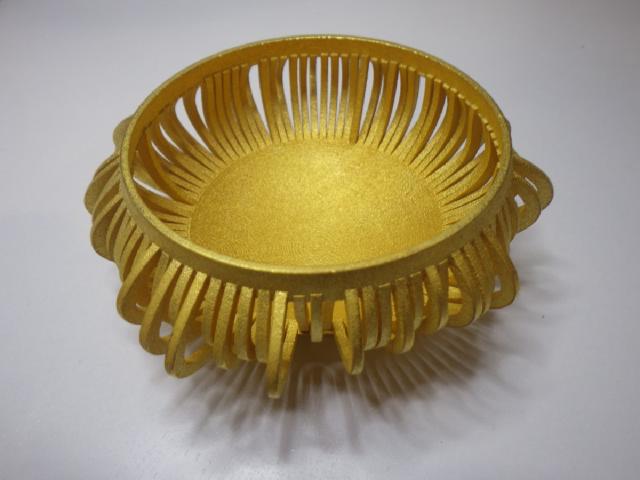 Stephen Barrass
Blood Pressure Shaped as a Bowl, Told by Its Ring: Chemo Singing Bowl
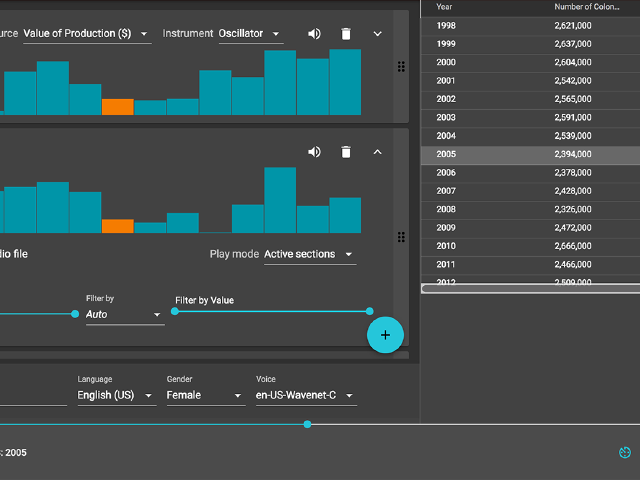 Datavized Technologies / Sonify
One Column as Pitch, One Row per Beat: TwoTone
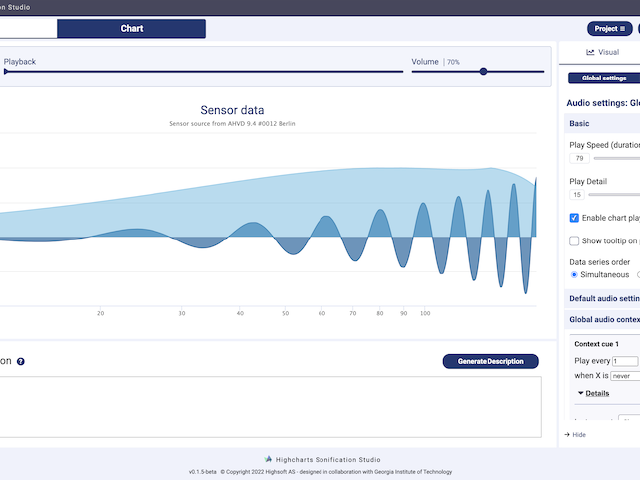 Highsoft / Georgia Tech Sonification Lab
A Table as a Line to See and Hear: Highcharts Sonification Studio
Recent
All posts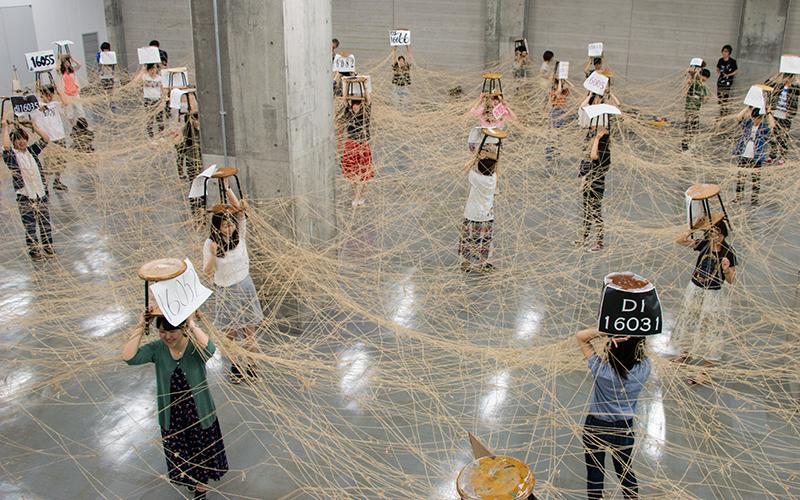 Turning 50 Students' Photo Loans into a Hemp-Cord Network Graph: The Final Session of Musashino Art University's "Information Processing I"
In 2016, the final session of "Jōhō Shori I" (Information Processing I) in the Department of Design Informatics, Musashino Art University, turned 50 first-year students' photo loans (36 links each) into a hemp-cord network graph on the floor, then lifted it on nankin stools for about five minutes.
 Painting 100 Years as 10×10 and One Year as 3×3: Peabody's Chronological History of the United States (1856)
Peabody's chart divides a century into 10×10 cells (one cell per year) and each year into 3×3 cells (kinds of events), then paints the nations in color. In her 1850 manual it was a tool for pupils to color in themselves and so memorize dates.
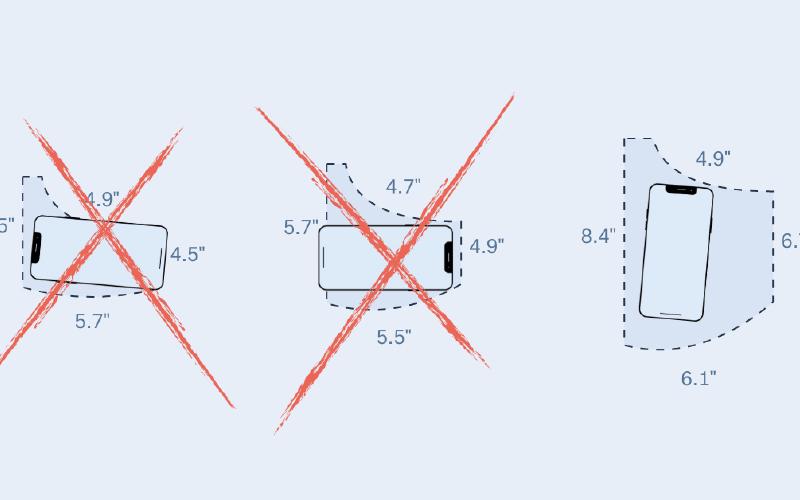 Overlaid at One Scale, Compared by Whether a Smartphone Fits: The Pudding's "Women's Pockets are Inferior"
The Pudding measured the front pockets of 80 pairs of jeans from 20 brands, overlaid men's and women's outlines at the same scale, then recast the gap as whether a smartphone or other objects fit.
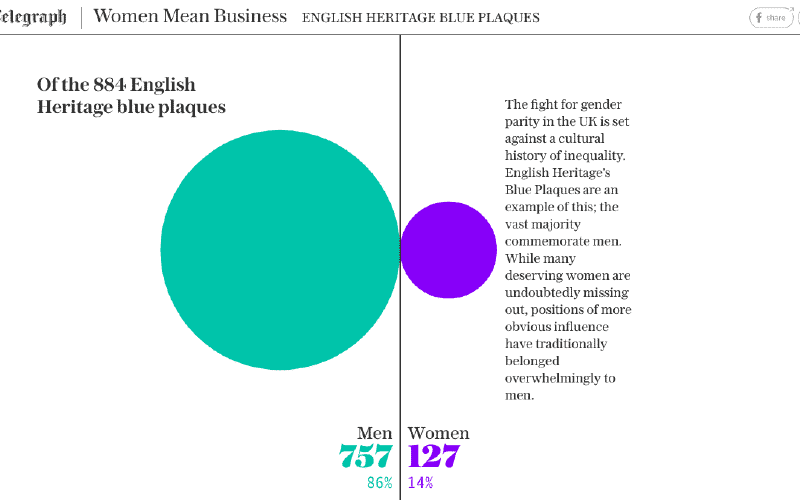 Dropping Pink and Blue, Giving Women the Purple That Stands Out on White: The Telegraph's "Born Equal. Treated Unequally."
In its charts on gender inequality, The Telegraph dropped pink and blue for the suffrage movement's purple and green, and gave women the purple, which stands out against a white background. The piece ran on International Women's Day, 8 March 2018.
Archive
Posts per year since 2013. Select a bar to see that year.