
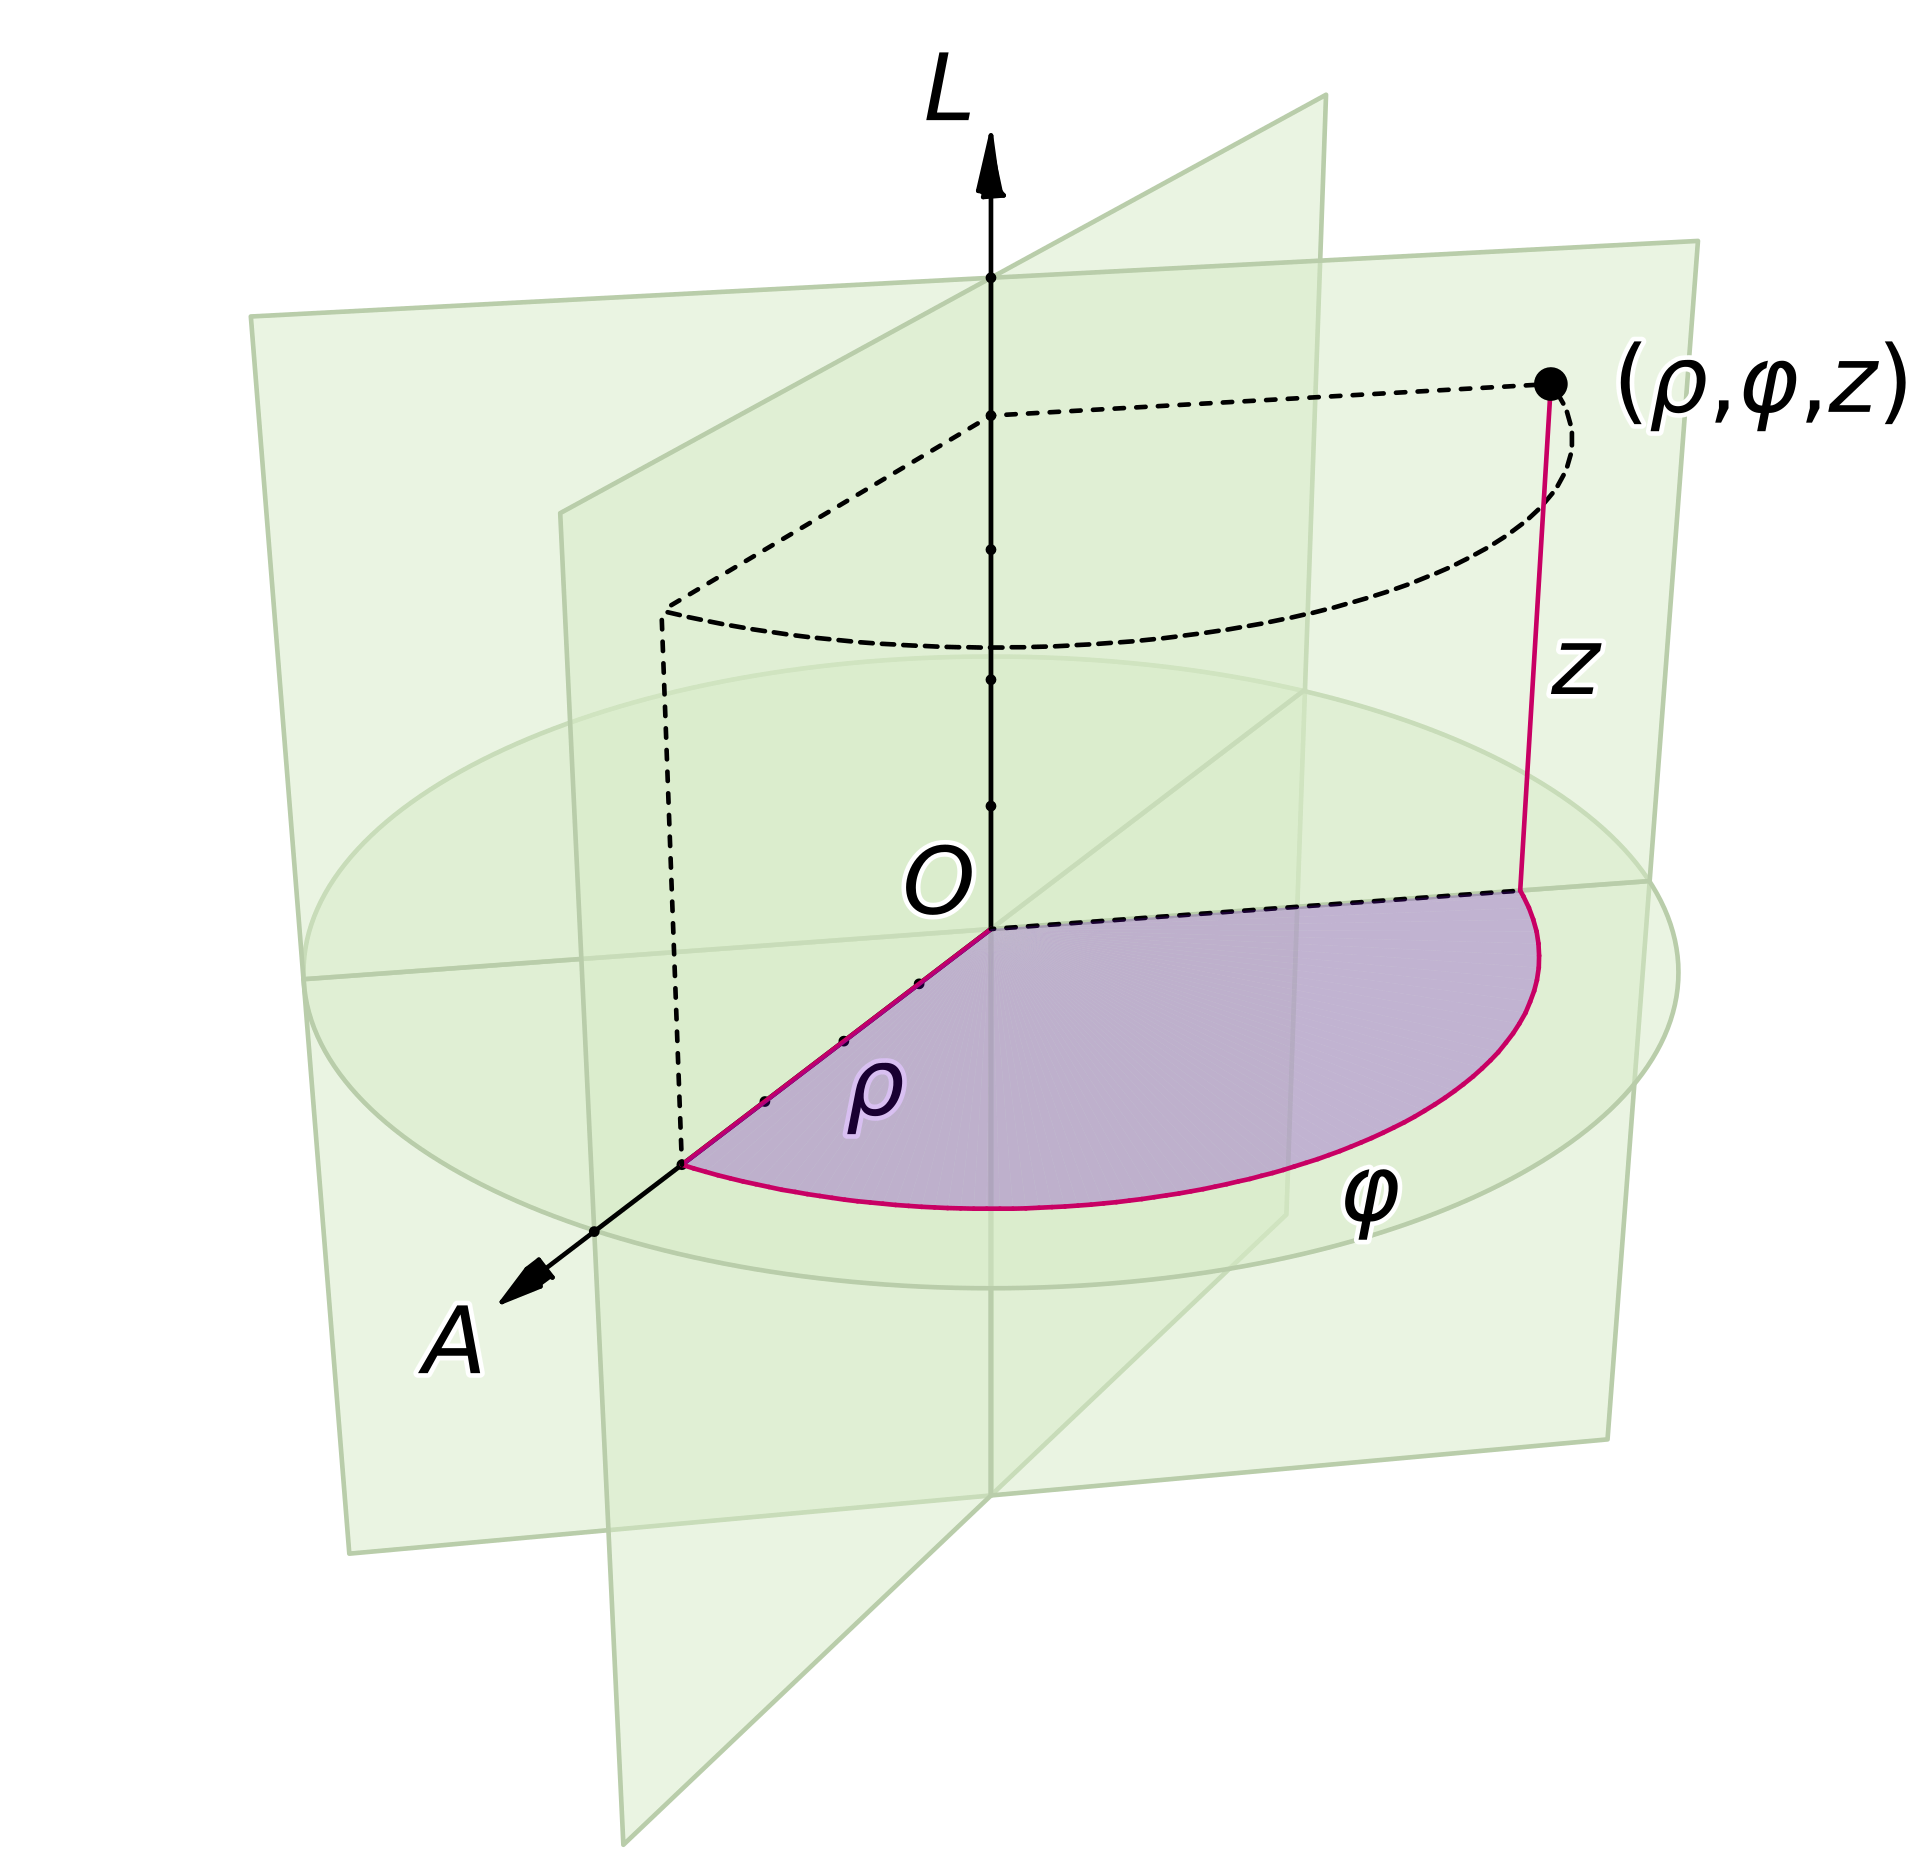
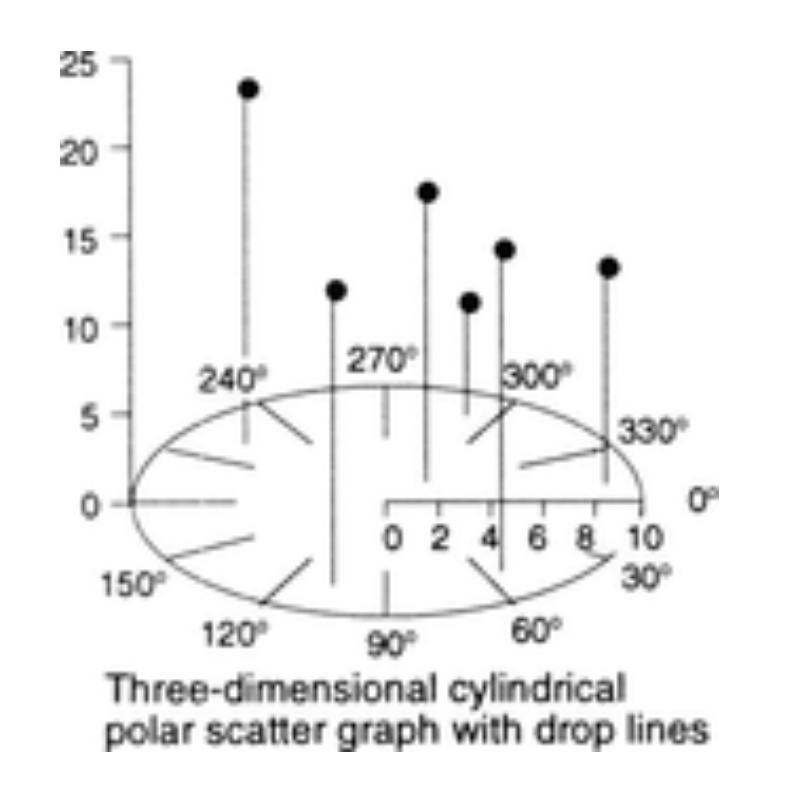
A three-dimensional cylindrical polar scatter graph uses cylindrical coordinates: angle, radius, and height. It visualizes three variables in a form related to a 3D extension of a polar plot. It is useful for multivariate data with directionality, periodicity, or radial structure.
How to Read It
The angle represents direction or phase, the radius represents distance or magnitude from the center, and height represents a third variable. Together they create a spatial distribution that can reveal directional and periodic patterns.
Use Cases
- Meteorological direction and intensity data
- Engineering measurements with angular components
- Earth science and oceanographic data
- Cyclical patterns with magnitude and height
Design Notes
- Label angular units clearly.
- Provide interaction or multiple views.
- Avoid visual clutter from too many points.
- Use color or transparency carefully.
Summary
This chart is specialized but useful when the data naturally fits cylindrical coordinates. It should be used when angle and radius are meaningful, not merely to make a chart look three-dimensional.