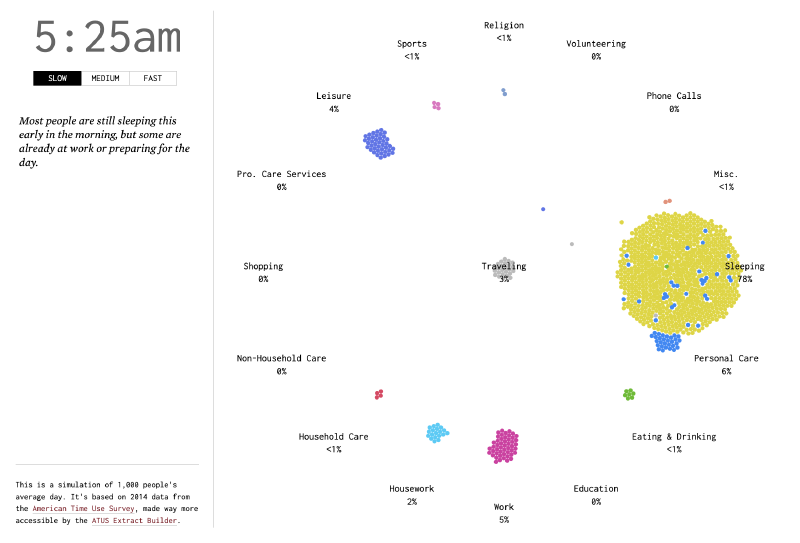
How do people spend a day? We often see this question answered with statistics, but rarely feel it as lived daily rhythm. Nathan Yau of FlowingData used microdata from the American Time Use Survey (ATUS) to simulate a typical day for 1,000 Americans and visualize how activities change over time.
The result is not just a statistical chart. It lets viewers experience the rhythm of many different lives moving through the same day.
Data and Method
The project is based on the 2014 American Time Use Survey from the U.S. Bureau of Labor Statistics. ATUS records how Americans aged 15 and older spend their day, classifying waking activities into categories.
Yau sampled individuals and animated their activity states over the course of a day, creating a simulated population whose daily behavior changes minute by minute.
Why It Matters
The visualization turns aggregate time-use statistics into something closer to observation. Viewers can see morning routines, work hours, meals, leisure, and sleep as flows rather than isolated percentages.
Summary
This project shows how simulation and animation can make survey data feel human. It transforms time-use statistics into a visible rhythm of daily life.