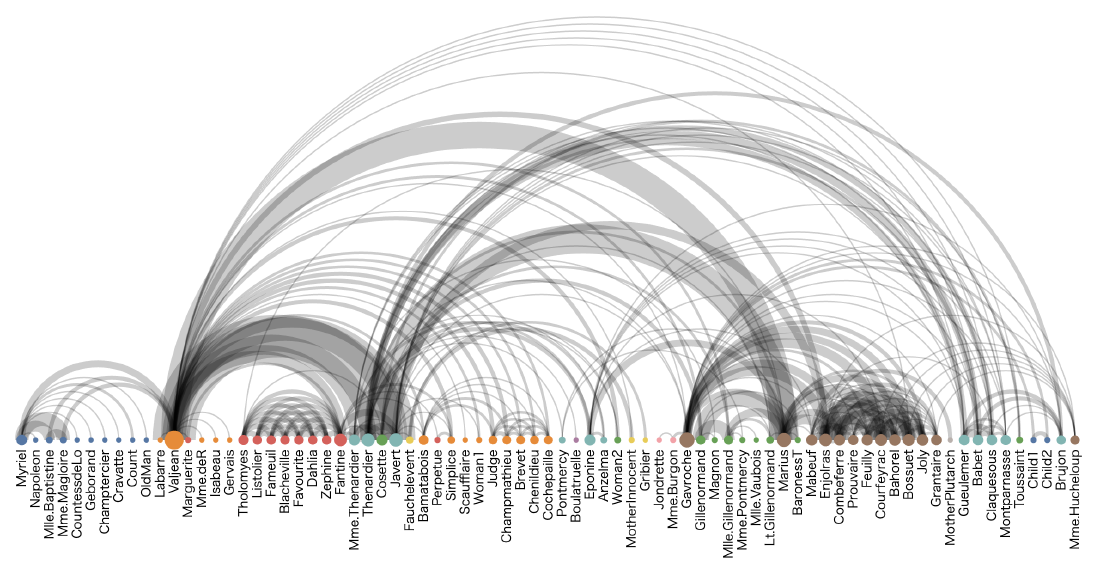
An arc diagram places nodes along a straight line and draws relationships as arcs above or below that line. It is a network visualization technique that can reveal patterns, symmetry, repetition, and long-range connections.

Design Notes
- Node ordering strongly affects readability.
- Use for moderate-sized networks.
- Separate directions or categories with color or arc side when helpful.
- Avoid dense networks with too many overlapping arcs.
Summary
Arc diagrams are simple network views where ordering is central. They work well when the sequence of nodes has meaning or when connection patterns are the main story.