
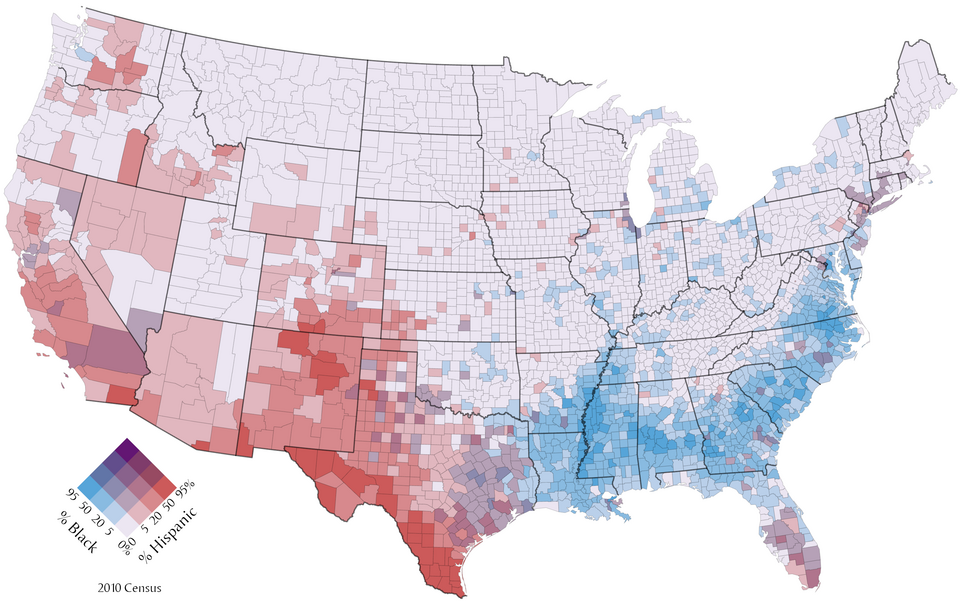
A bivariate choropleth map represents two variables on one map. Instead of using one color scale for one variable, it combines two color axes so each region’s color represents a paired value.
Purpose
The purpose is to show the spatial relationship between two variables, such as income and education, or vulnerability and exposure.
Design Notes
- Use a simple 2x2 or 3x3 legend.
- Choose variables that have a meaningful relationship.
- Avoid too many color classes.
- Make sure readers understand the mixed-color legend.
Summary
Bivariate choropleth maps are powerful for showing two-variable spatial patterns, but they require careful legends and restrained color design.