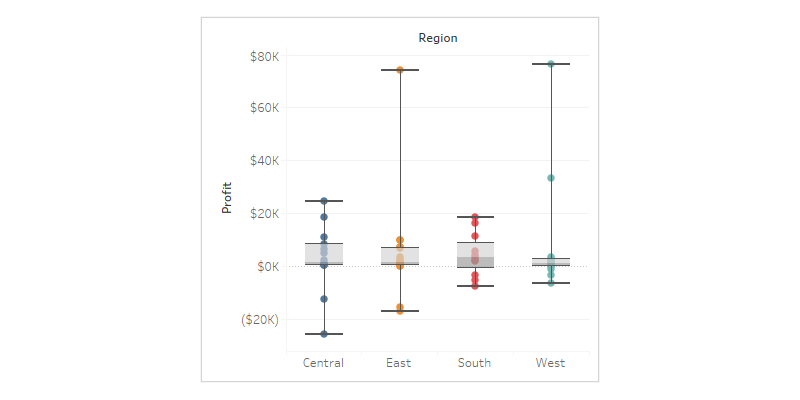
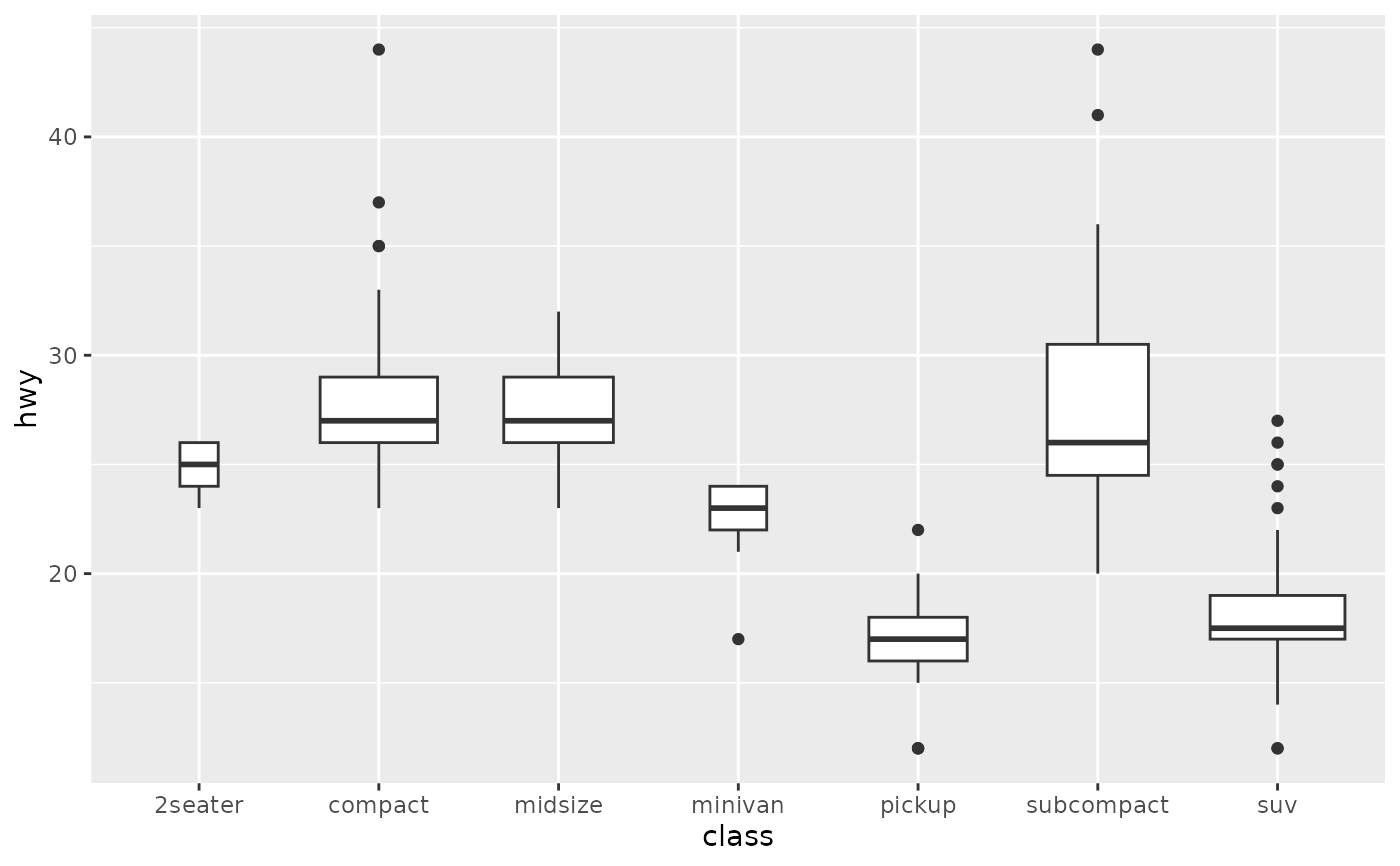
A box-and-whisker plot summarizes a distribution using the minimum, first quartile, median, third quartile, and maximum, often with outliers shown as individual points. The box represents the interquartile range, or IQR.
Purpose
The purpose is to compare distributions compactly across groups. Box plots show center, spread, skew, and outliers without plotting every observation.
Design Notes
- Explain the whisker rule when necessary.
- Use alongside raw points for small datasets.
- Do not hide important distribution shape when multimodality matters.
- Consider violin plots when density shape is important.
Summary
Box plots are compact and robust distribution summaries. They are especially useful for comparing many groups.