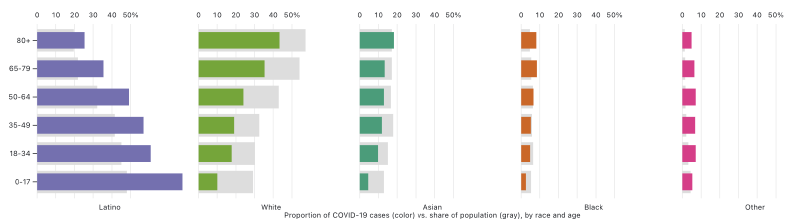
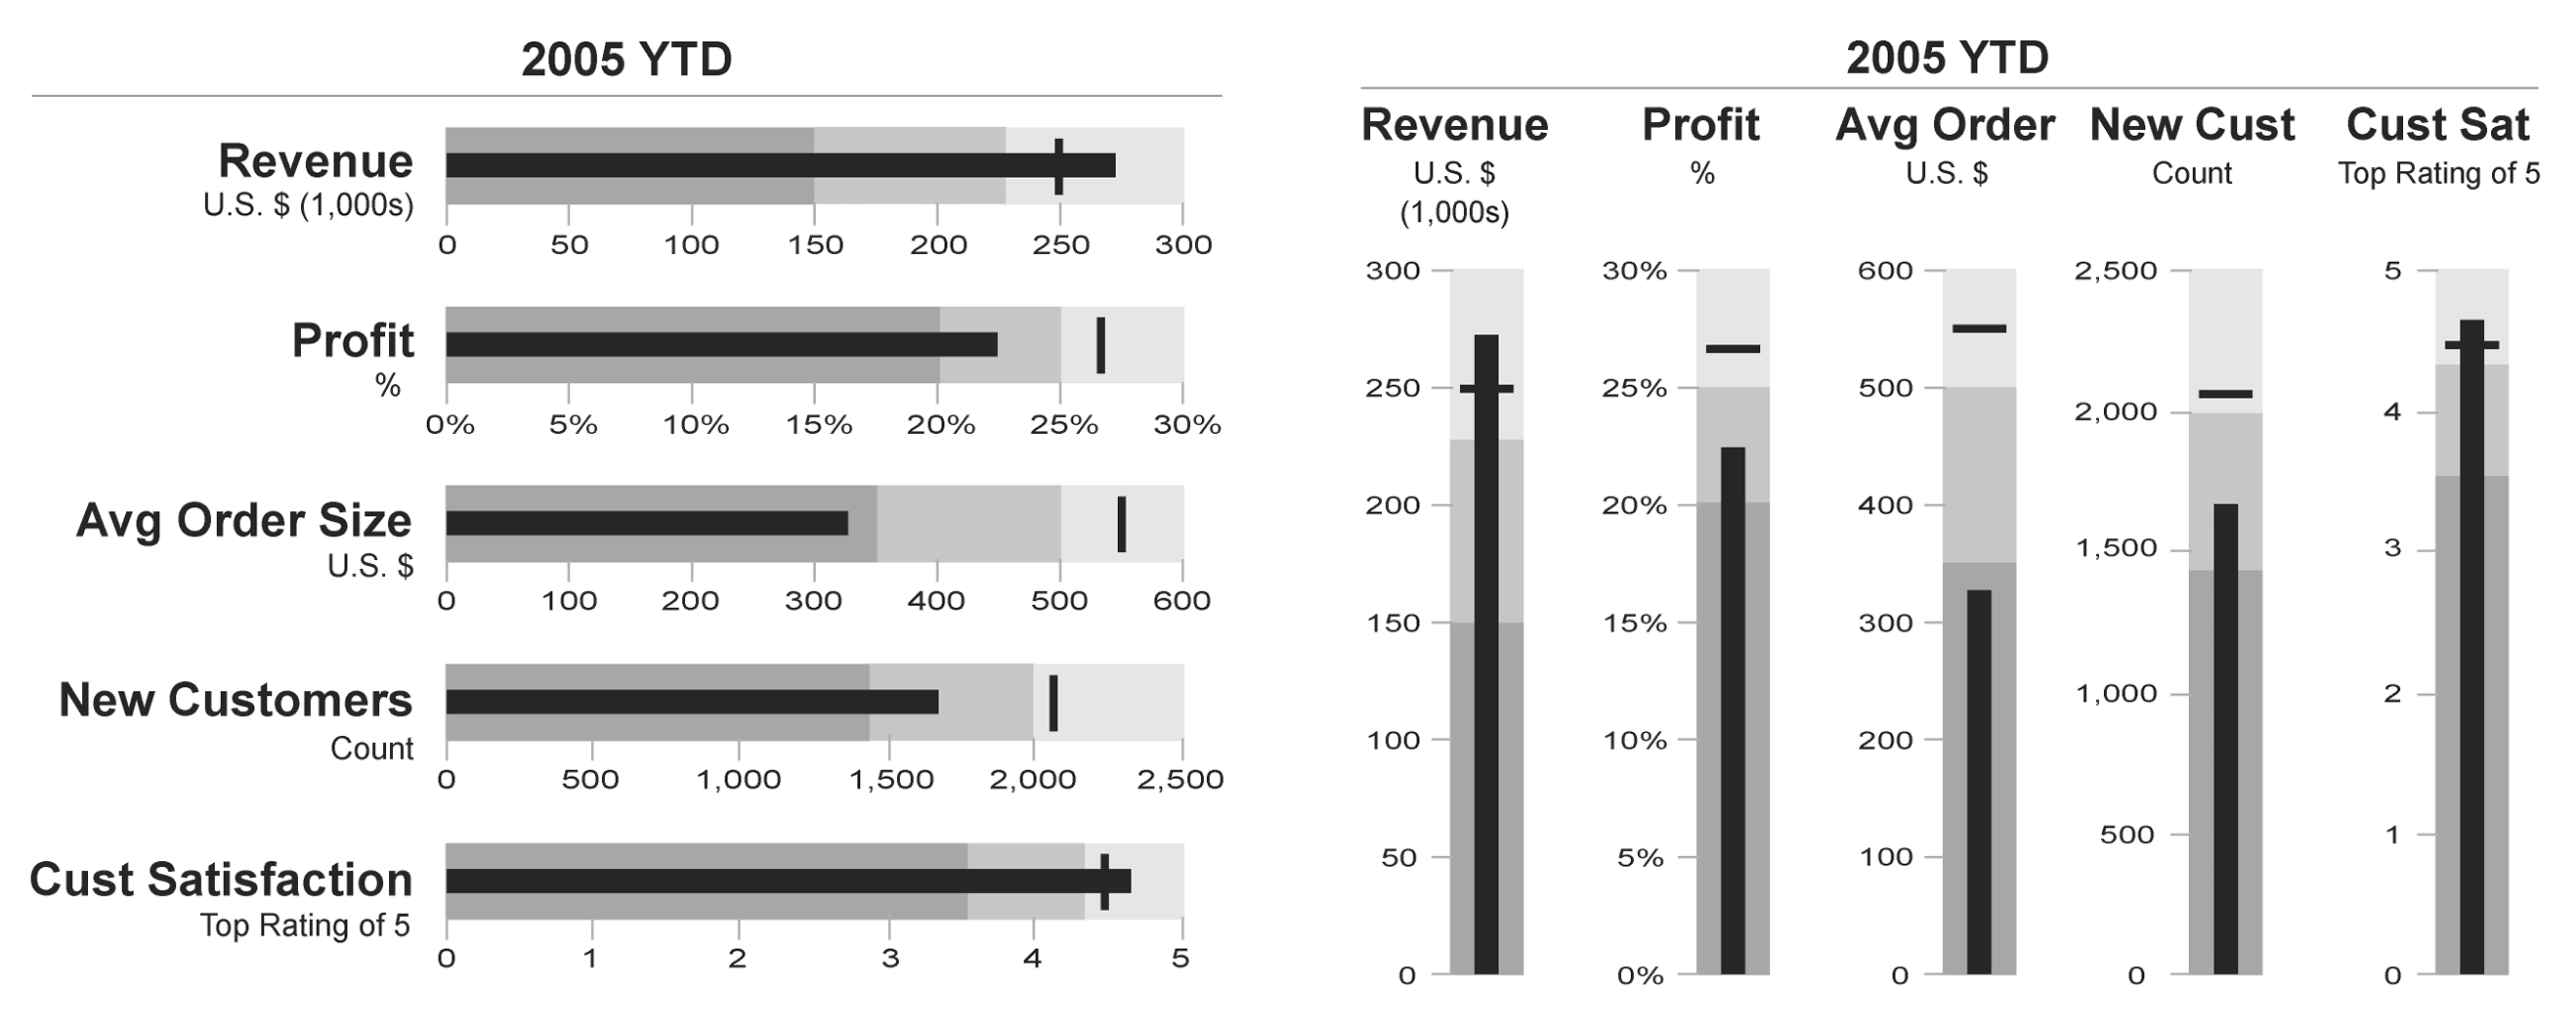
A bullet graph is a compact chart for showing performance against a target. It extends a bar chart by combining an actual value, qualitative ranges such as poor, satisfactory, and good, and a target marker.
Historical Background
Bullet graphs were developed by Stephen Few as a more space-efficient and informative alternative to dashboard gauges.
Design Notes
- Use a clear target marker.
- Keep qualitative ranges subtle.
- Avoid decorative gauge-like styling.
- Use consistent scales when comparing multiple bullet graphs.
Summary
Bullet graphs are strong dashboard components because they show actual value, target, and performance context in a compact form.