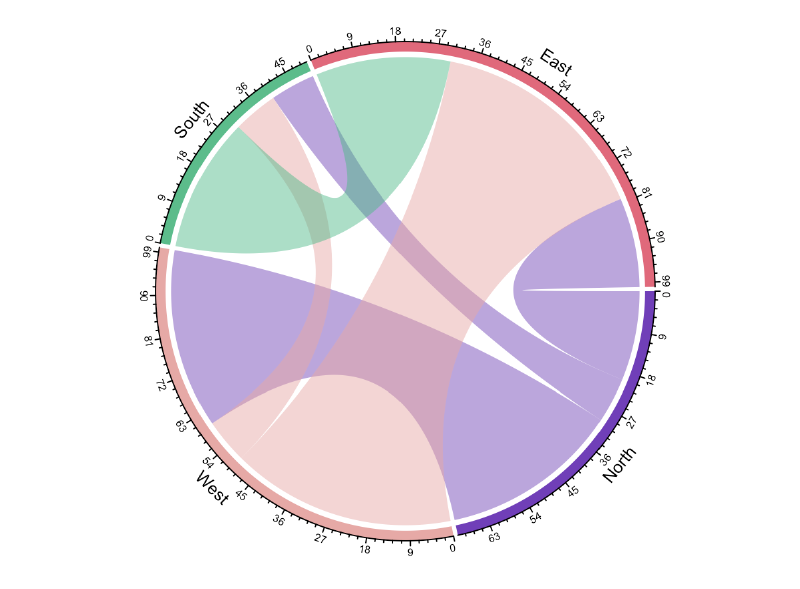
A chord diagram visualizes relationships or flows among categories arranged around a circle. Curved bands, or chords, connect categories, and their thickness or color represents strength or direction.

Use Cases
- Migration flows
- Trade between countries
- Network relationships among categories
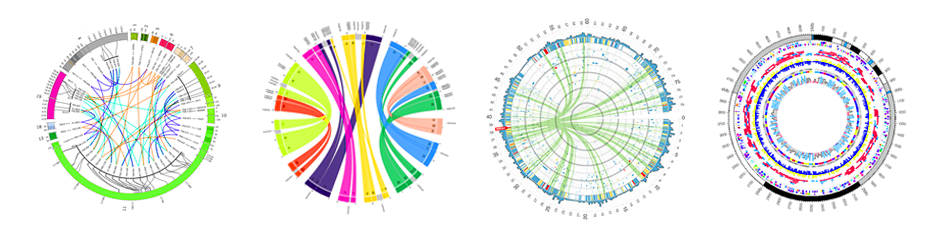
- Genomic and biological relationships
Design Notes
- Limit the number of categories.
- Use ordering to reduce crossings.
- Make direction clear if flows are directional.
- Provide interaction for dense diagrams.
Summary
Chord diagrams are visually striking and useful for showing many-to-many relationships. They can become difficult to read when too many categories or chords are included.