Brian Foo’s “Two Trains” is a piece of music in which the distance between stations on New York’s 2 subway line sets the length of each section, and the median income around each station sets the number, type, and force of the instruments that play. The author writes, “The number and type of instruments are selected based on that station’s surrounding median income.” The song is made of 48 sections connecting 49 stations, and runs about four and a half minutes in total. Most of the notes come from the E major scale, derived from the subway’s door chime (the author writes, “Most of the notes”).
The work is the first track of Foo’s music series “Data-Driven DJ,” and was released in January 2015. What follows draws on the author’s work page and FAQ, the code and sample data on GitHub, and three third-party articles. Where the numbers differ between sources, they are shown side by side. Other works that turn data into sound are also read in Chemo Singing Bowl and Quotidian Record.
2015: Making a Song That Rides the 2 Train
Foo is a programmer and visual artist based in New York. Data-Driven DJ is a series of ten tracks, and its home page describes it as musical experiments that combine “data, algorithms, and borrowed sounds.” The video was uploaded to Vimeo on January 31, 2015. The track is released under CC BY 4.0, and the code under the MIT License.
Foo gives his reasons for choosing the 2 line on the work page. It runs through three boroughs (Brooklyn, Manhattan, and the Bronx) and along Broadway. And then there is a graph of income.
“When I was looking at a graph of income inequality along the 2 Train, it looked like the perfect song composition with a build-up, climax, and falling action.”
The graph of income inequality along the 2 line looked to him like the structure of a song, with a build-up, a climax, and a falling action. This can be read as using a visualization as a preview before composing.
Foo also names time as a reason. Sonifying data requires the passage of time. So rather than seeing everything at once in a graph, you experience the data in sequence, as if riding the train.
There are two datasets. Income is the median household income around each station, from the U.S. Census Bureau’s American Community Survey 2011 Release. Station locations are the latitude and longitude from NYC Open Data’s “Subway Entrances.” The 49 stations run from Flatbush Ave.–Brooklyn College to Wakefield–241 St.
Distance Becomes Length, Income Becomes a “Budget”
According to the work page, the actual ride takes about 1 hour 45 minutes. The song compresses this to about four and a half minutes, which corresponds to a train running without stopping at about 336 miles per hour (540 km/h). In the code (subway.py), the number of beats in a section is the distance in meters divided by 75, rounded. The tempo is 120 BPM, so one beat is 0.5 seconds. That is 150 m per second, which matches 540 km/h.
The way income is mapped has the shape of shopping. According to the README, a station’s monthly income (the annual figure divided by 12) is that station’s “budget.” In the instrument table, each instrument has a “price” from 0 to 400. The script goes down the table from the top, buys an instrument if its price is lower than the remaining budget, and subtracts the price from the budget. When it hits an instrument that is too expensive, it stops there.
The other mechanism is the income percentile. For each instrument, the range of stations where it can be used is set by rank among the 49 stations. In the sample table, the same clarinet has a maximum volume of 0.2 for stations in percentiles 0 to 60, and 0.4 for stations in percentiles 60 to 100. Vocals 1 has three tiers, with the maximum volume rising through 0.05, 0.1, and 0.2.
The work page says that when the train passes through wealthy areas such as the financial district, the number of instruments, the volume, and the forcefulness increase.
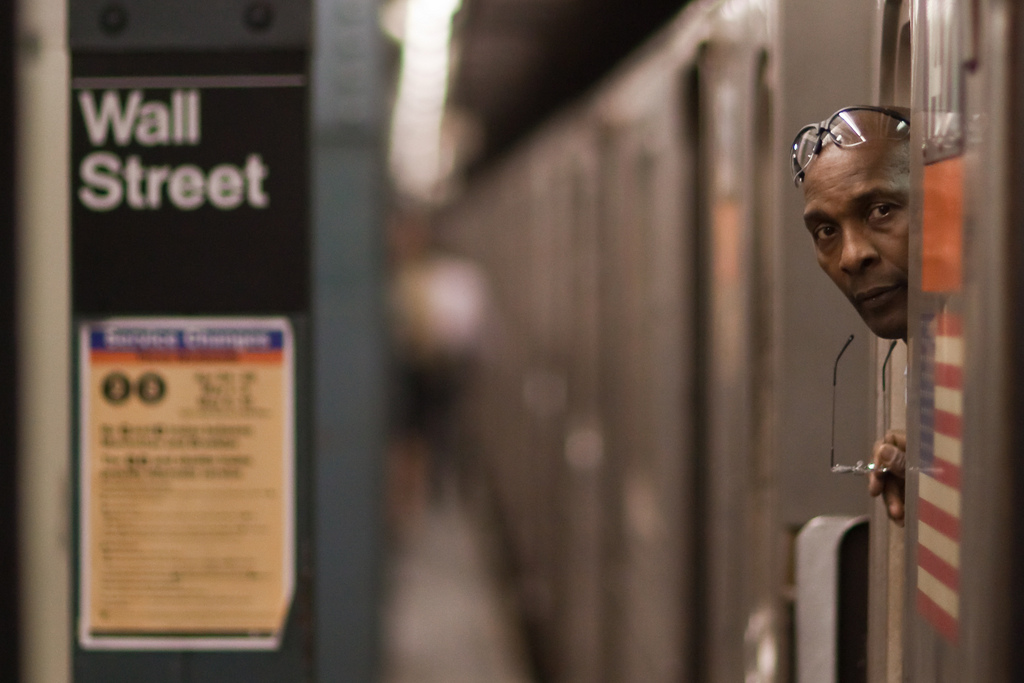
From the work page of Data-Driven DJ “Two Trains” (photographer not credited)
The table below summarizes the mapping between data and sound, based on the work page and the code.
| Data | How it is expressed in sound | Rule / value | Source |
|---|---|---|---|
| Distance to the next station | Length of the section | Beats = distance (m) ÷ 75. 120 BPM | Work page, subway.py |
| Income around the station (monthly) | Number of instruments that play | Monthly income is the budget; instruments are bought from the top of the table | subway.py, README |
| Income percentile | Type of instrument and volume cap | The higher the range, the higher the maximum volume | Sample table |
| Income (author’s summary) | Number and dynamics of instruments | 3 to 30 instruments in each section | Work page |
| — (passage of time) | Fluctuation of volume and tempo | Sine curve with a period per instrument | subway.py |
| — (jitter) | Offset of note timing | ±20 ms. Halton sequence | subway.py |
| — (pitch) | Scale and chords | Mostly E major notes | Work page |
| Borough | Not used in the sound | Shown in the accompanying video | subway.py |
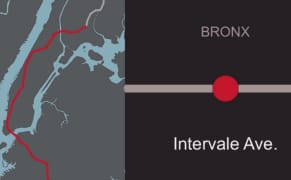
Brian Foo (video still) / From Hyperallergic
The names of the boroughs are shown not in the sound but in the accompanying video, made with Processing.
Income Is Not Mapped Directly to Pitch: The Chime and Steve Reich
The scale of the song is chosen for reasons separate from income. According to the work page, the subway’s door chime comes from the two notes G# and E of the Westminster Chimes. Of the key built on them, E major (E, F#, G#, B), the author writes, “Most of the notes in my song also come from this scale.” In other words, most of the notes in the song come from this scale.
The stylistic model is Steve Reich’s “New York Counterpoint,” a piece for eleven clarinets. The 40 clarinet and bass clarinet samples in Two Trains play notes from D major and E major chords.
The work page lists phase shifting as one of the pillars of the song. It is a technique in which the same melody is repeated at slightly different tempos, drifting apart and coming back together, and the author explains that Terry Riley and Reich pioneered it in the 1960s.
“I felt this was the perfect metaphor for the NYC Subway: constantly looping but at different tempos, always running but never on time, phasing between order and chaos.”
Looping at different tempos, always running but never on time: this was the perfect metaphor for the subway. In the code, this fluctuation is made with sine curves. It is the style of the song, not data.
The composition is entirely algorithmic, and the work page says, “I did not manually compose any part of this song.” The sound material is 63 samples: 16 from songs by New York musicians, 40 clarinet-family samples, 6 xylophone samples, and 1 train horn.
So why did Foo choose volume and force to represent income? He writes:
“To be as objective as possible, the same rules are applied throughout the whole song. Also, I tried to select agnostic sound traits (e.g. volume, force) to correlate to median income rather than biased ones (e.g. sad vs happy sounds, vibrant vs dull sounds) to further let the data “speak for itself.””
In short: to be objective, the same rules are applied from the beginning of the song to the end. For income, he chose neutral sound traits such as volume and force, rather than biased ones such as sad versus happy. Sound traits that change mood were taken out of the representation of income.
As far as the code shows, what income changes is which samples play and the cap on volume. The sample file names include playing styles from pianissimo to fortissimo. The differences in force can be read as arising from both the samples that could be bought and the volume cap.
As for pitch, the code shows no rule that assigns income directly to pitch, as far as it can be read. However, the samples that play change with income, and each sample has its own pitch (Gs4, E3, D2, and so on). So the combination of pitches you hear changes with income indirectly.
On the other hand, the series FAQ describes an advantage of expressing data as music with the words “the creator can manipulate mood.” The series says it uses mood, while this song says it does not use mood for income. There can be read to be a tension between the two statements.
“3 to 30 Instruments” and “1:37”: Numbers That Differ by Source
The work page says that “between 3 and 30 instruments” play in each section. When this article’s researcher recounted the sample table on GitHub using the same rules as subway.py, a different number came out. It is not the author’s number, but a reference value.
| Source | What was counted | Value |
|---|---|---|
| Work page (author) | Instruments playing in each section | 3 to 30 |
| Researcher’s recalculation | Rows of the instrument table assigned to one station | 9 (E 180 St. and others) to 62 (Wall St., Chambers St., and others) |
The two can be read as not counting the same thing. The table includes vocals with a price of 0, and the same timbre appears as separate rows for each percentile. The work page links to a Google spreadsheet as the final data, but I have not checked whether the sample table is the same as that.
The times differ as well. The author writes that the loudest part is Park Place to Chambers St. (income $205,192) at 1:37, and the quietest part is E 180 St. to Bronx Park East ($13,750) at 3:53.
| Source | Subject | Value |
|---|---|---|
| Work page (author) | Length of the song | About 4.5 minutes |
| Vimeo video | Length of the video | 286 seconds |
| Researcher’s recalculation | Length of the main body | 261.5 seconds |
| Work page (author) | Loudest part | 1:37 |
| Researcher’s recalculation | Start of the Park Place→Chambers St. section | 1:16 |
| Work page (author) | Quietest part | 3:53 |
| Researcher’s recalculation | Start of the E 180 St. section | 3:32 |
Both recalculated times are about 21 seconds earlier than the author’s. The video is about 24 seconds longer than the main body, which can be read as due to an introduction or margin at the start, but I have not confirmed the cause.
How Third Parties Saw the Song
The three articles look at different points. The first is a comparison with a precedent. Allison Meier of Hyperallergic (February 2015) set it beside Daniel Crawford’s “A Song of Our Warming Planet” (2013).
“Both projects make what can be abstract data into a narrative aural experience.”
Her assessment is that both turn data that can easily become abstract into a narrative listening experience. She also valued that, because the code is public, anyone can turn their own line into a song.
The second is a question from the music side. Molly Sheridan of New Music USA (July 2015) praised the choice of material, saying that anyone who knows Reich will hear the connection at once. She then asks:
“Should the music sound “better” when passing through rich neighborhoods in his presentation of income? … Where is the line between representation and judgment?”
Should the music sound “better” when it passes through rich neighborhoods, and where is the line between representation and judgment? Sheridan also reports that Foo does not retouch the song to make only parts of it sound good, and keeps the whole song faithful to the data.
The third concerns the relationship with visualization. Science Friday (February 2017) cited Foo as an example and wrote:
“so-called “data sonifiers” don’t expect their work to replace data visualizations, but rather complement the facts and figures they depict”
The view is that people who turn data into sound aim to complement visualizations, not to replace them.
Takeaways
There are four judgments to take back to visualization work.
The first is to narrow down the elements that carry data and fix the rest. In Two Trains, the length of time represents distance, and the number and force of instruments represent income. Phase shifting and the jitter of note timing are style, unrelated to the data. The scale, too, can be read as not directly assigned to income. It can be read as the same construction as a bar chart that uses only length for data and fixes color as decoration.
The second is to assign a variable that invites value judgments a trait that does not sway mood. Even so, Sheridan’s question remains. It can be read that it is not possible to fully avoid a loud sound seeming “rich.” In charts too, I think it is worth checking whether the brightness of a color looks like good versus bad.
The third is to place ordered data on a time axis. A line has an order of stations, and that order becomes the time of the song as it is. In expressions that use a time axis, it can be read as good to first check whether the data has a natural order.
The fourth is to publish the rules and the code, and to attach how things were counted and the standards used. Because the code and sample data were public, a recalculation was possible. As a result, it became clear that the author’s numbers and the recalculation from the sample data do not match. I have not confirmed the cause. What was counted, and whether the times include the introduction: if that much is written down, I think listeners can check the numbers against each other.
References
Primary sources
- Brian Foo, Data-Driven DJ (series description, table of contents, Press section). https://datadrivendj.com/
- Brian Foo, “Two Trains — Sonification of Income Inequality on the NYC Subway” (work page). https://datadrivendj.com/tracks/subway/
- Brian Foo, Data-Driven DJ FAQ. https://datadrivendj.com/faq/
- beefoo/music-lab-scripts (GitHub repository). https://github.com/beefoo/music-lab-scripts
- README of 01_subway. https://github.com/beefoo/music-lab-scripts/tree/master/01_subway (raw: https://raw.githubusercontent.com/beefoo/music-lab-scripts/master/01_subway/README.md)
- subway.py. https://raw.githubusercontent.com/beefoo/music-lab-scripts/master/01_subway/subway.py
- data/stations.csv.sample. https://raw.githubusercontent.com/beefoo/music-lab-scripts/master/01_subway/data/stations.csv.sample
- data/instruments.csv.sample. https://raw.githubusercontent.com/beefoo/music-lab-scripts/master/01_subway/data/instruments.csv.sample
- LICENSE (MIT). https://raw.githubusercontent.com/beefoo/music-lab-scripts/master/LICENSE
- Vimeo video (uploaded 2015-01-31, 286 seconds). https://vimeo.com/118358642
- SoundCloud (audio). https://soundcloud.com/functionfoo/two-trains-sonification-of-income-inequality-on-the-nyc-subway
- Data source: U.S. Census Bureau, American Community Survey 2011 Release. http://www.census.gov/acs/www/data_documentation/2011_release/
- Data source: NYC Open Data, Subway Entrances. https://data.cityofnewyork.us/Transportation/Subway-Entrances/drex-xx56
Secondary sources
- Allison Meier, “Data-Driven Music for the Disharmony of New York’s Income Inequality,” Hyperallergic, 2015-02-10. https://hyperallergic.com/180725/data-driven-music-to-for-the-disharmony-of-new-yorks-income-inequality/
- Molly Sheridan, “Data-Driven DJ Brian Foo: Statistics That Sing,” New Music USA, 2015-07-22. https://newmusicusa.org/?p=277105
- “How to Listen to Data,” Science Friday, 2017-02-07. https://www.sciencefriday.com/articles/how-to-listen-to-data/
- “Hear the Sound of NYC’s Income Gap on This Data-Driven Subway Ride,” VICE (Creators Project). https://www.vice.com/en/article/hear-the-sound-of-nycs-income-gap-on-this-data-driven-subway-ride/