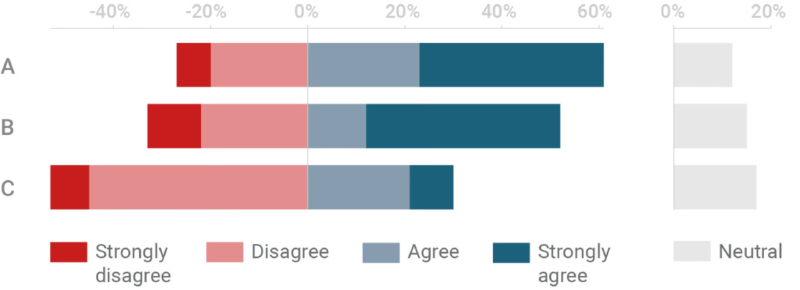
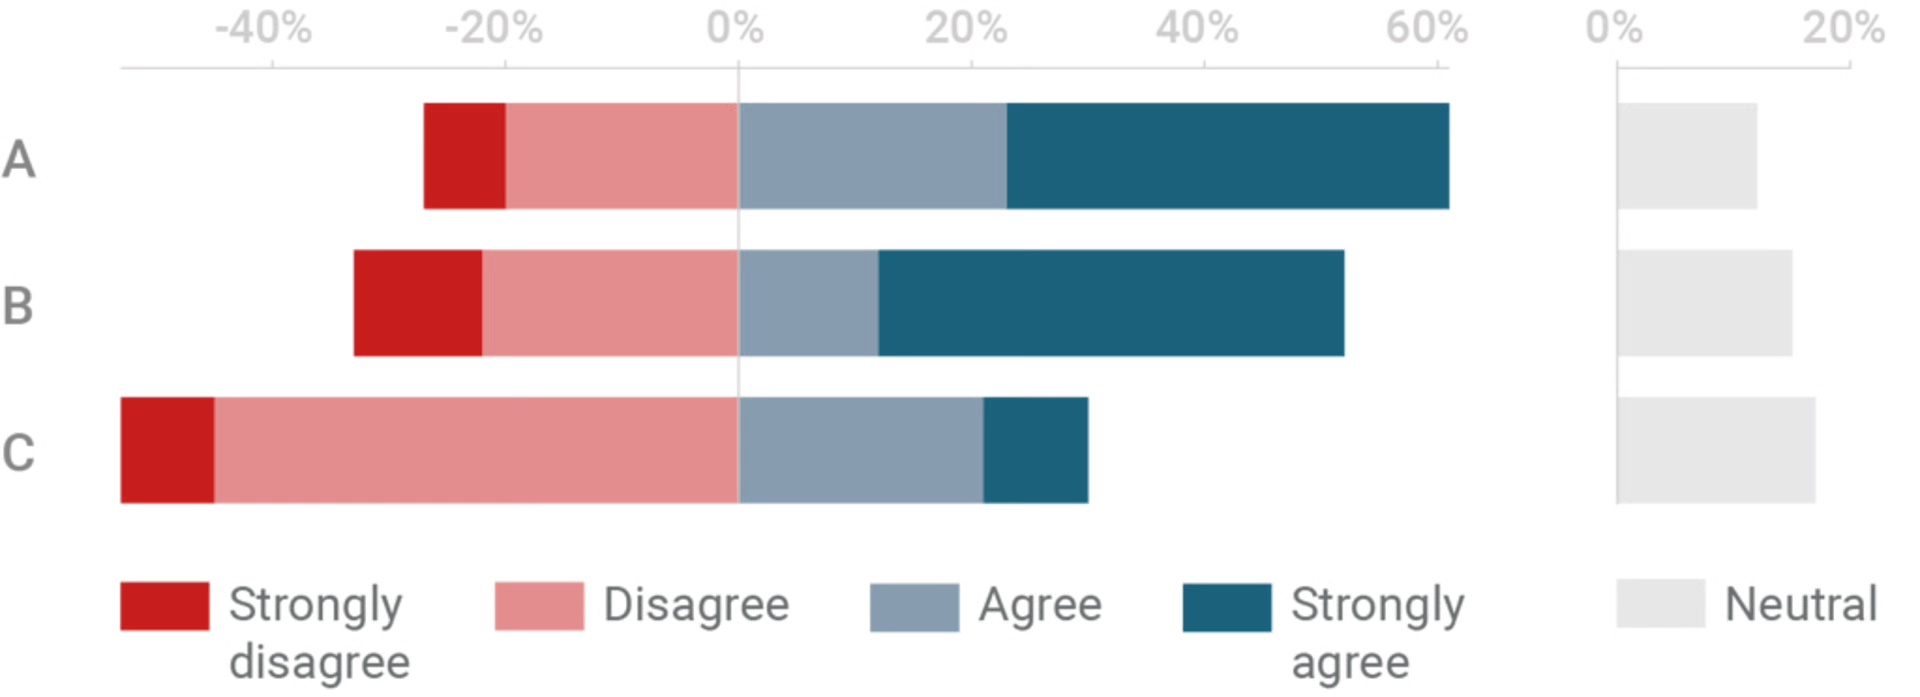
A diverging stacked bar chart compares opposing response categories around a central baseline. It is commonly used for Likert-scale survey results, where agreement and disagreement are placed on opposite sides of zero.
Purpose
The purpose is to show the balance between positive and negative responses while preserving category composition.
Design Notes
- Place neutral responses carefully, either centered or separated.
- Use consistent colors for negative and positive categories.
- Sort items by net agreement or another meaningful metric.
- Avoid too many response levels.
Summary
Diverging stacked bar charts are strong for survey and sentiment data because they make polarity visible. They require careful treatment of neutral categories and color order.