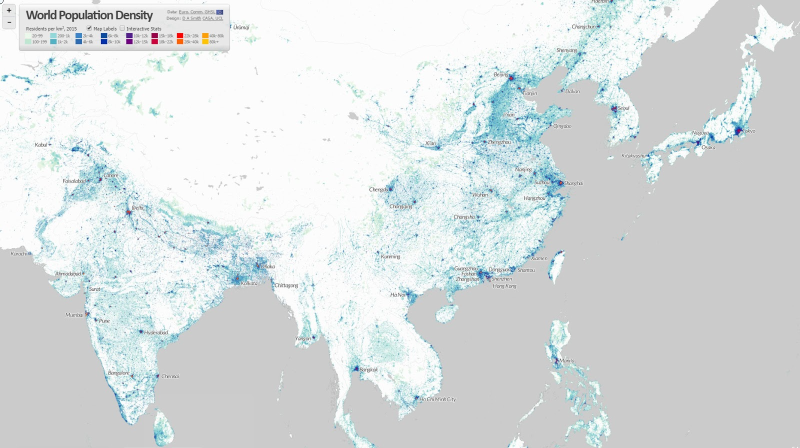
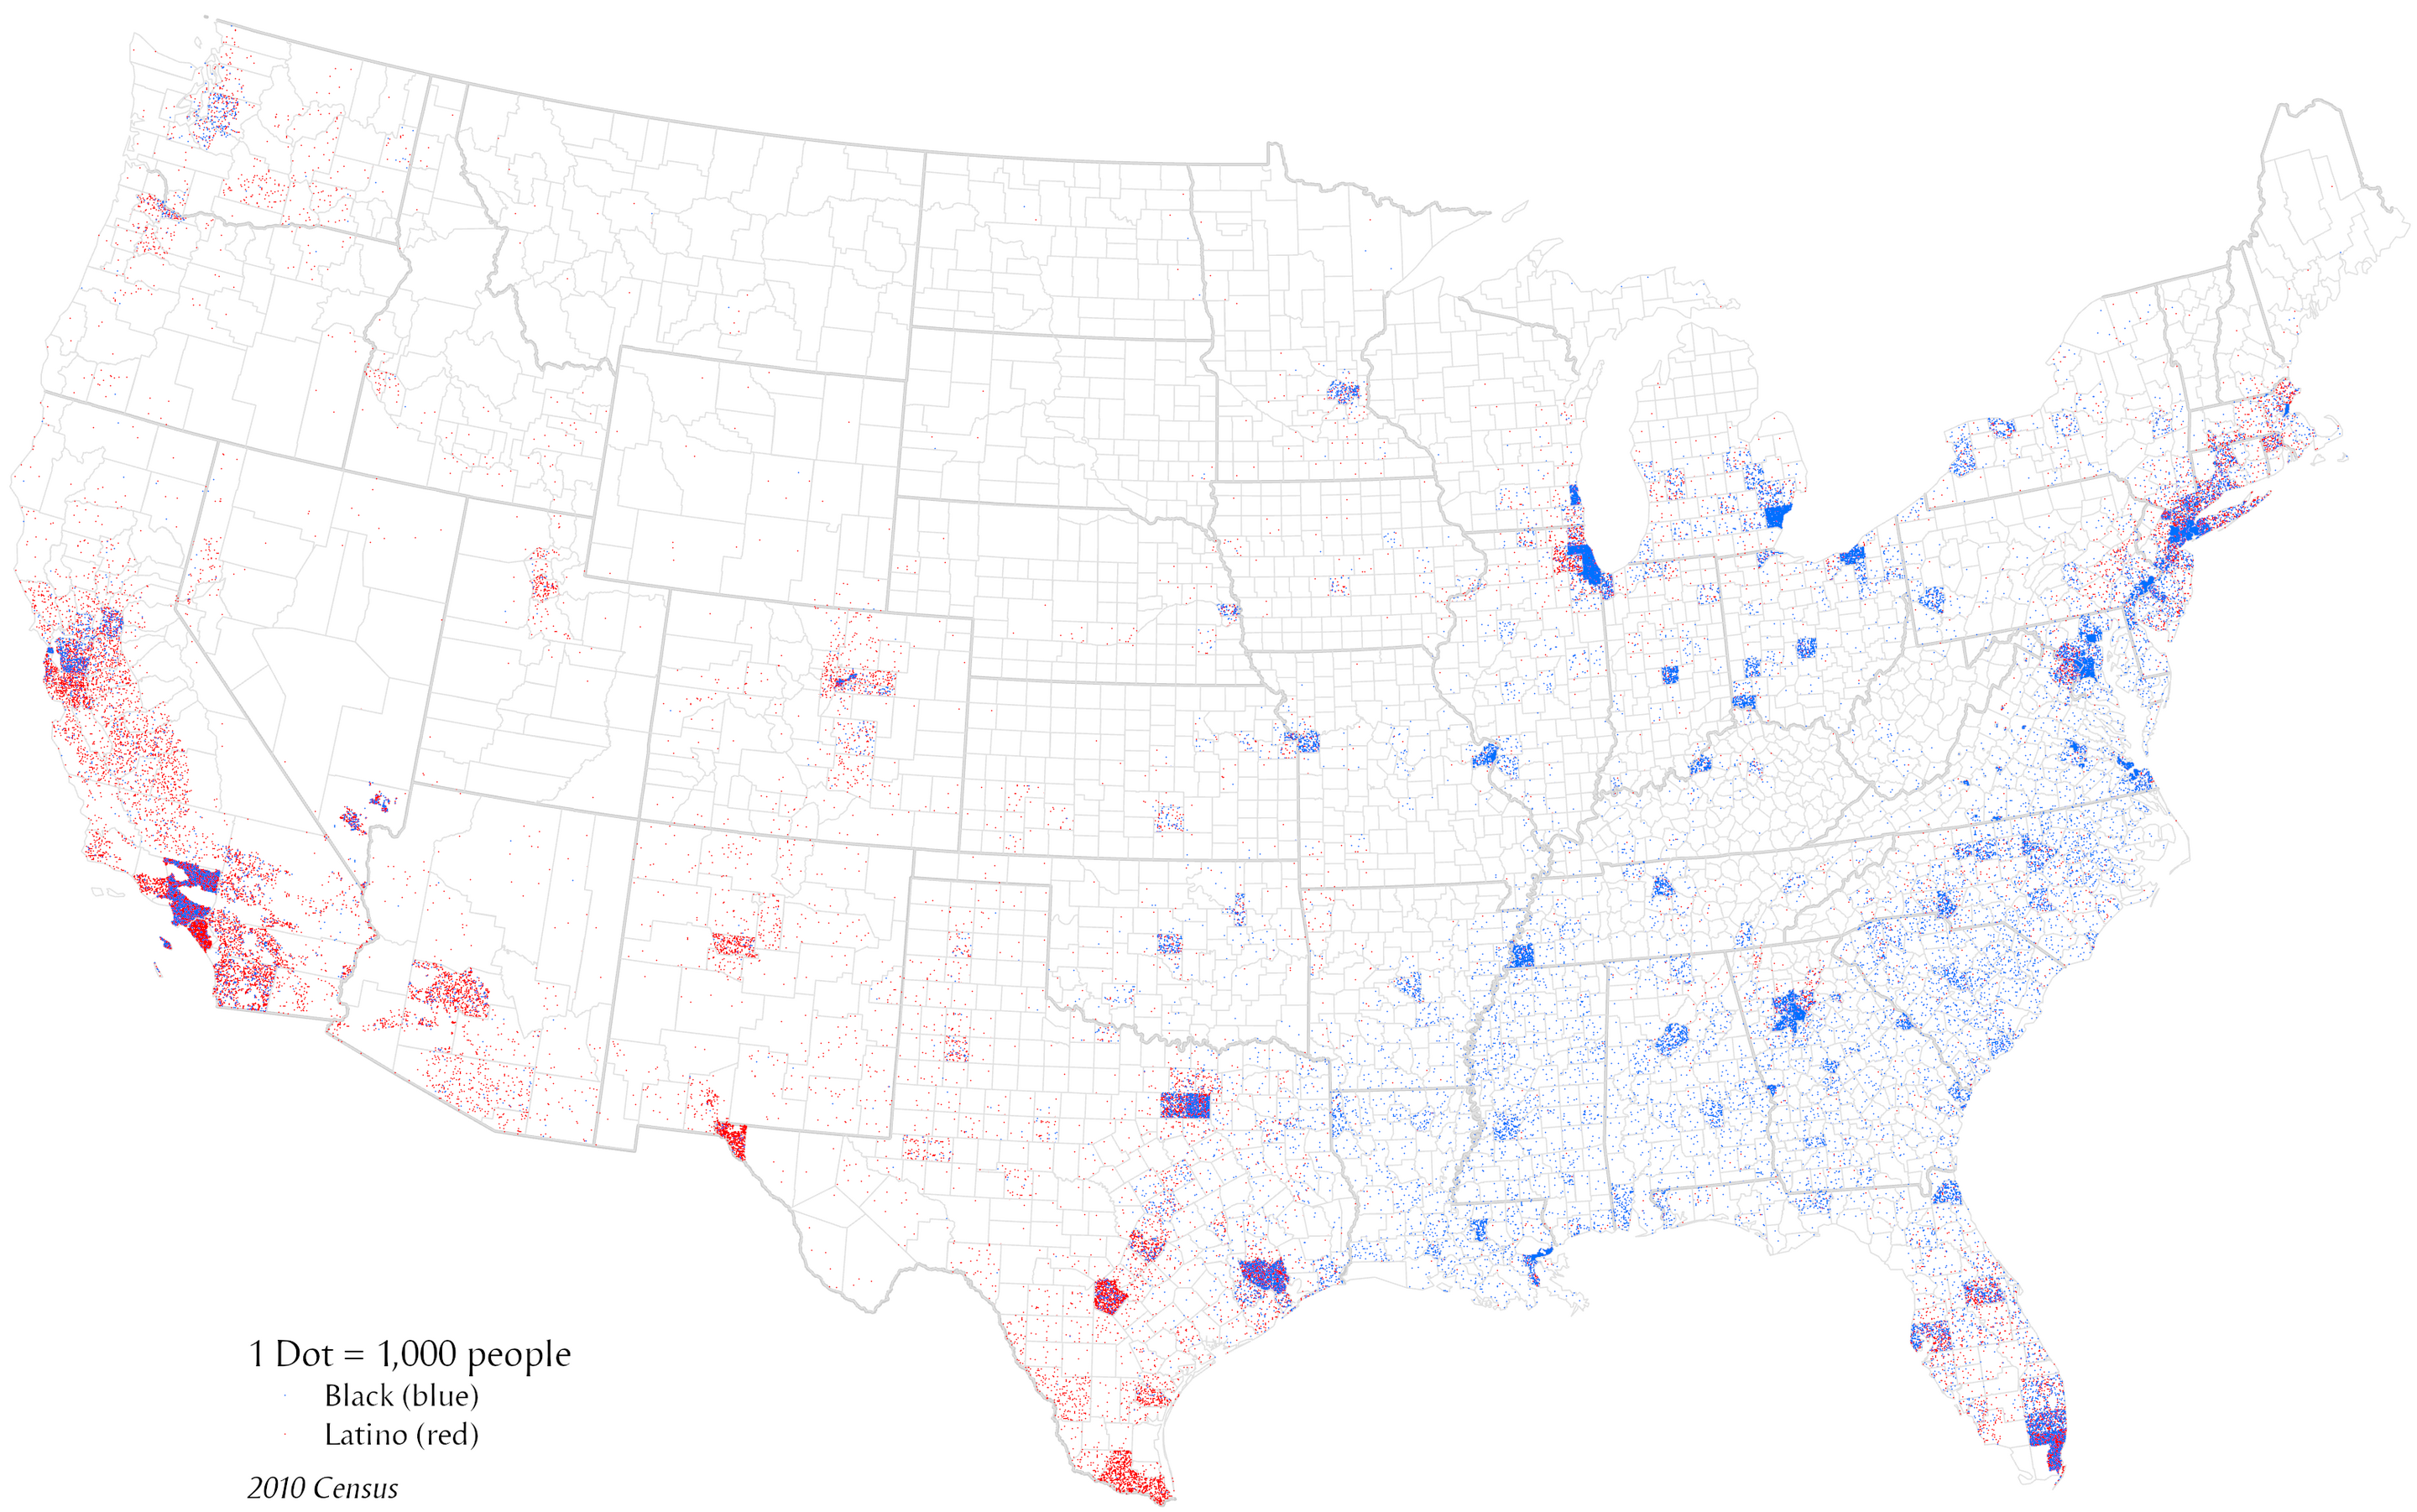
A dot density map represents geographic distribution through the density of dots. Each dot stands for a fixed quantity, such as 100 people or one household, and dots are placed within areas to show regional patterns.
Purpose
The purpose is to show spatial concentration and spread while avoiding the area bias of choropleth maps. Dense dot clusters indicate high values or high concentration.
Design Notes
- State what one dot represents.
- Avoid implying exact locations when dots are randomly placed within areas.
- Use small dots and appropriate transparency.
- Consider dasymetric placement when internal distribution is known.
Summary
Dot density maps are useful for showing population and other distributed quantities. They communicate density intuitively, but readers must understand that dots may represent quantities, not exact locations.