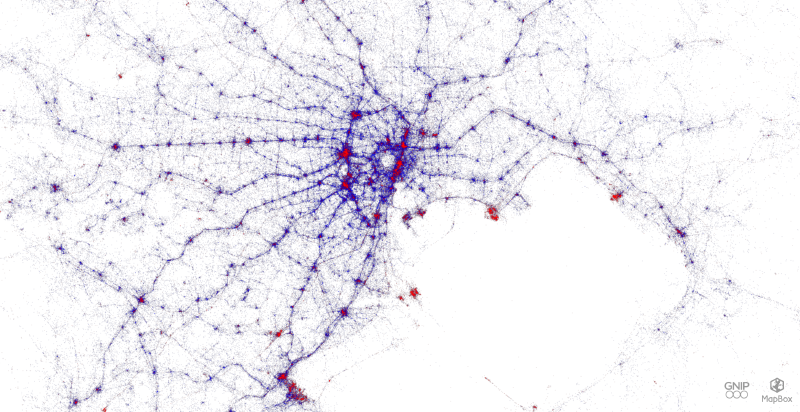
A dot map plots individual observations as dots at their geographic locations. One dot represents one event, object, or observation. It is also called a dot distribution map, and is useful for showing the geographic distribution of precise locations such as earthquakes, stores, or incidents.
Historical Background
Dot maps have roots in nineteenth-century cartography. John Snow’s 1854 cholera map in London is a famous early example of plotting individual cases geographically.
Design Notes
- Use dot maps when locations themselves matter.
- Avoid overplotting by using transparency or clustering.
- Do not confuse dot maps with dot density maps, where one dot may represent many units.
- Provide enough basemap context for interpretation.
Summary
Dot maps are direct and powerful when the data consists of individual locations. They show where observations occur without aggregating them into regions.