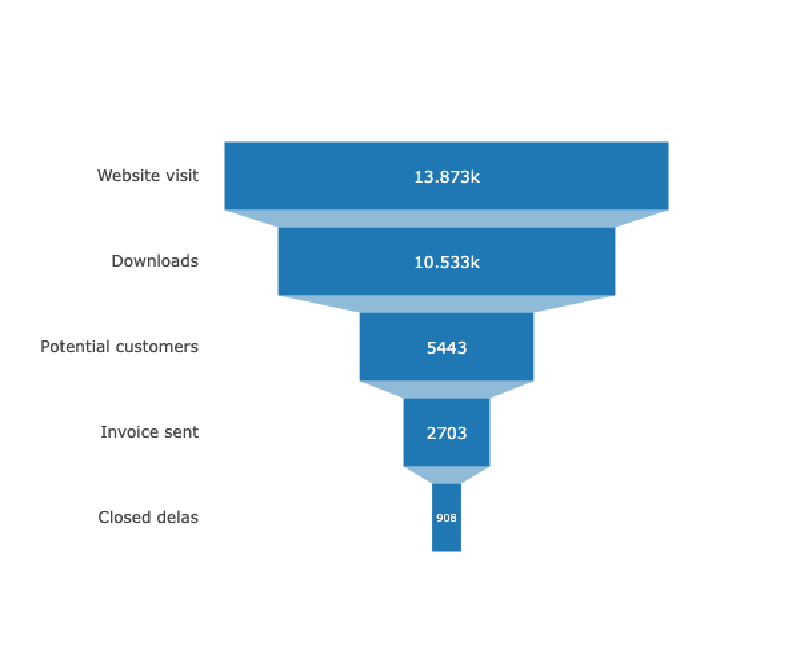
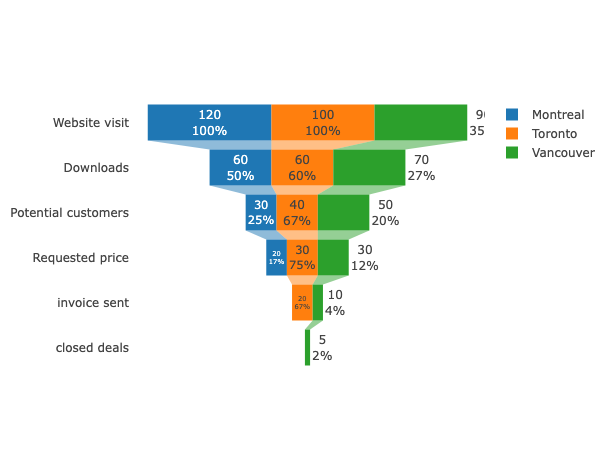
A funnel chart visualizes the decrease in quantity across stages of a process. Its width narrows from top to bottom, resembling a funnel. It is common in marketing and sales analysis, such as website visits, product views, cart additions, and completed purchases.
Historical Background
The funnel concept in marketing traces back to the AIDA model proposed by E. St. Elmo Lewis in 1898: Attention, Interest, Desire, and Action. It describes how people move through stages before purchase.
How to Read It
Each stage shows the number or percentage remaining. The drop between stages indicates loss or conversion. The most important insight is often where the largest drop-off occurs.
Design Notes
- Use consistent stage definitions.
- Show both counts and conversion rates when useful.
- Avoid 3D funnel effects.
- Consider bar charts when exact comparison is more important than the funnel metaphor.
Summary
Funnel charts are useful for communicating staged drop-off in processes. They are most effective when the process truly narrows from one stage to the next.