Is a straight line on a map also straight on the Earth? Not necessarily.
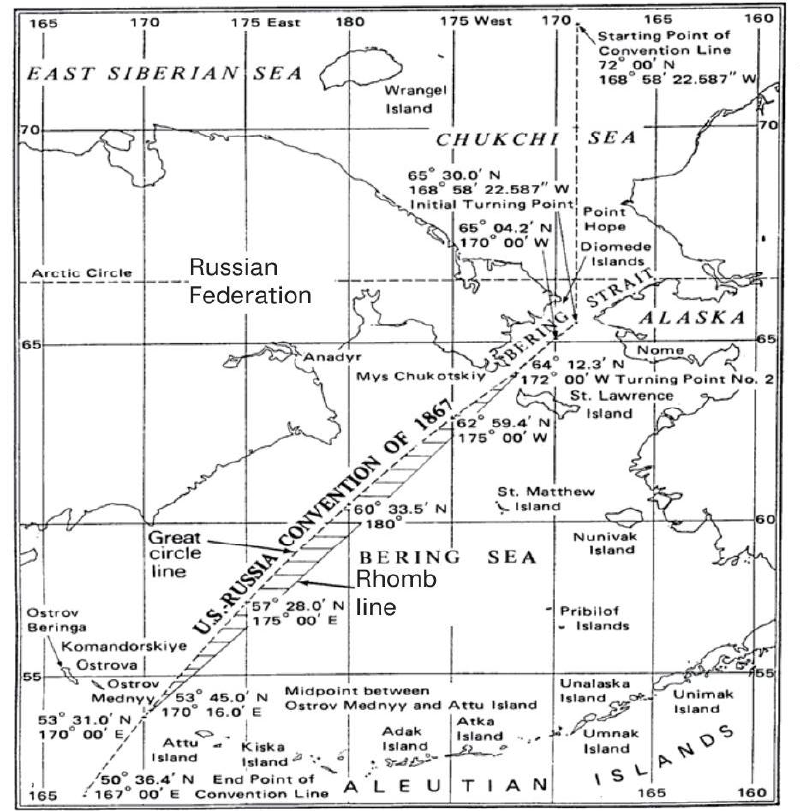
The 1990 U.S.-USSR Maritime Boundary Agreement exposed exactly this problem. The United States and the Soviet Union read the same treaty text, but interpreted the line through different map projections. As a result, the boundary at sea could shift by tens of thousands of square kilometers depending on the projection used.
The Problem
Maps flatten the Earth, and every projection distorts something: area, shape, distance, or direction. A line that looks straight in one projection may curve in another. In maritime boundary agreements, this is not a minor cartographic detail. It can determine which country controls fishing grounds, seabed resources, and strategic waters.
Projection and Legal Interpretation
The dispute centered on how to interpret a line drawn or described using a particular map framework. If the line is treated as a straight line on a Mercator map, it follows a rhumb line. If it is interpreted on the globe, it may follow a geodesic or another path.
Both interpretations can sound reasonable unless the treaty explicitly defines the coordinate reference system and geometric rule. This is why modern geospatial agreements must specify not only points but also how lines between them are to be understood.
Why It Matters
The case demonstrates that map design is not only visual communication. It can have legal, political, and economic consequences. A projection is a mathematical model, and choosing one can change the apparent meaning of a boundary.
How to Read Such Maps
When reading maps involving borders or maritime lines, check:
- Which projection is used.
- Whether a line is a rhumb line, geodesic, or straight screen line.
- Whether coordinates are specified in a treaty or metadata.
- Whether the map is illustrative or legally authoritative.
Summary
The U.S.-USSR maritime boundary case shows that the geometry behind a map can change real-world interpretation. A line on a flat map is never neutral unless its projection and rules are specified. For data visualization and cartography, this is a reminder that visual form and mathematical definition cannot be separated.