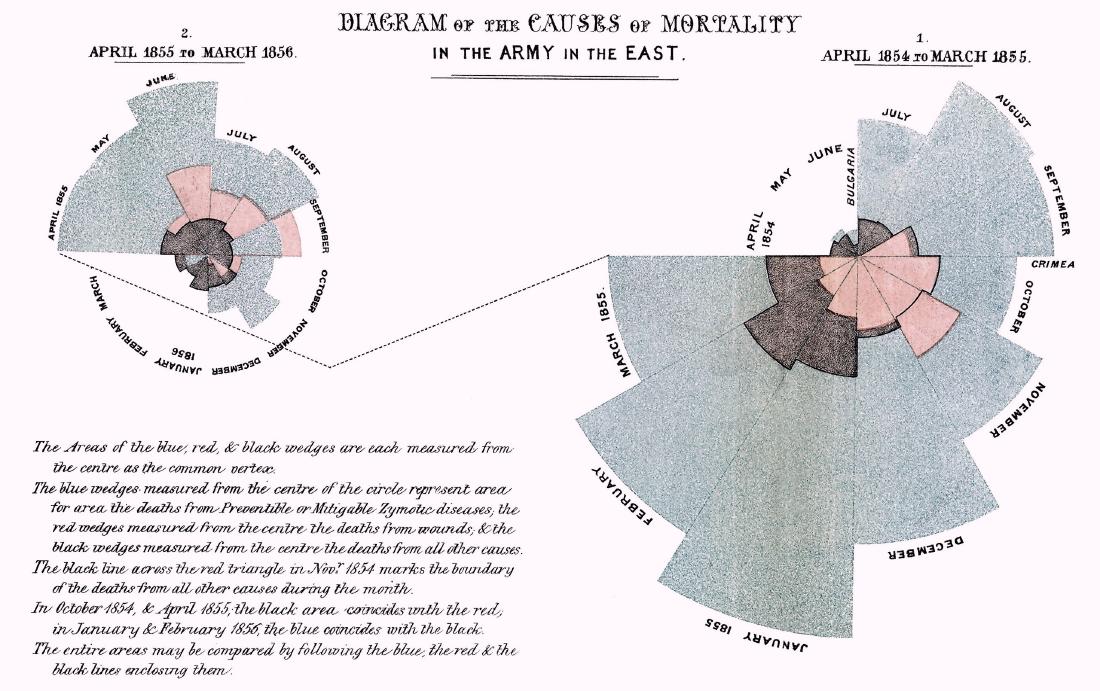
This article introduces Florence Nightingale’s Coxcomb Chart, explaining what the method shows, how to read it, and what design decisions matter.
The focus is on how the visual form supports comparison, pattern recognition, and explanation.
How to Read It
Start by identifying the data units, the visual encodings, and the direction of comparison. Then read the overall pattern before moving to individual values. This helps separate the main structure from small local variation.
When to Use It
Use this approach when the audience needs to understand a relationship that would be hard to see in a table. It is most effective when the chart type matches the question: comparison, distribution, hierarchy, flow, geography, or change over time.
Design Notes
- Clarify what each visual channel represents before interpreting the graphic.
- Use labels, legends, and units so readers can distinguish pattern from measurement.
- Choose the method only when its visual structure matches the analytical question.
- Avoid unnecessary decoration that makes comparison harder.
Summary
Florence Nightingale’s Coxcomb Chart is useful when its structure fits the data and the reading task. As with any visualization method, the key is to make the encoding explicit and avoid asking the form to do more than it can support.