Good charts are not only about looking clean. They are about making fair comparisons.
When units and scales differ, comparing raw values can be misleading. Normalization and standardization transform values into a fairer form so that the underlying balance becomes easier to see.
Why It Matters
A food may look high in protein, but that impression can change depending on whether you compare per package, per gram, per calorie, or relative to the distribution of alternatives. The same problem appears in business, education, public policy, and data visualization.
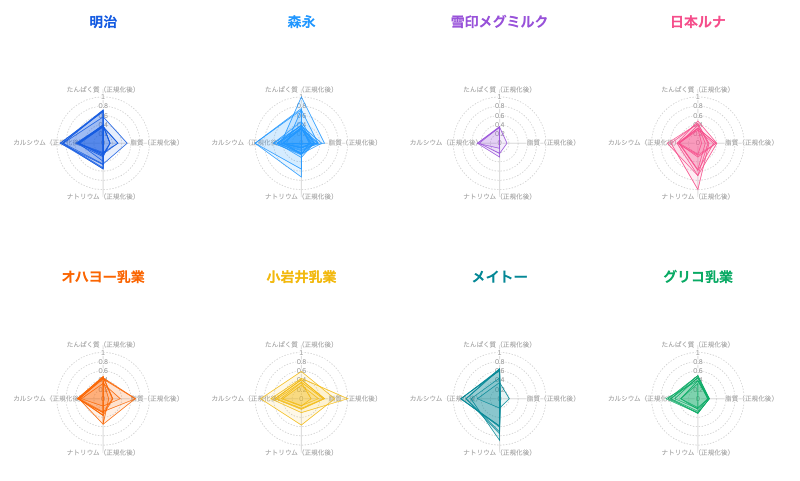
Normalization
Normalization usually rescales values into a common range, often from 0 to 1. It is useful when you want to compare indicators that have different units but should contribute to a combined score or visual comparison.
Standardization
Standardization transforms values based on the mean and standard deviation. A standardized value shows how far an observation is from the average in units of standard deviation. This is useful when comparing unusualness across different variables.
Design Notes
- Do not compare raw values when units or denominators differ.
- Explain which transformation was used.
- Keep original units available when readers need practical interpretation.
- Use normalization for range-based comparison and standardization for deviation from an average.
Summary
Normalization and standardization are basic but essential techniques for fair comparison. In visualization, they help prevent scale differences from becoming visual bias.