Polaris is a system and formal language for exploratory analysis of multidimensional databases. Developed at Stanford University in the early 2000s by Chris Stolte, Pat Hanrahan, and collaborators, it later became a core intellectual foundation of Tableau.
Its key idea is that visualization itself can be defined as a declarative query against data. Polaris is therefore not just a graph-drawing tool; it integrates analysis, aggregation, and visual representation into one framework.
The 2008 CACM Paper
The most accessible introduction is the 2008 Communications of the ACM paper, “Polaris: A System for Query, Analysis, and Visualization of Multidimensional Databases.” It builds on earlier academic work published in IEEE TVCG and explains the design motivation, practical significance, and connection to Tableau.
Why Polaris Matters
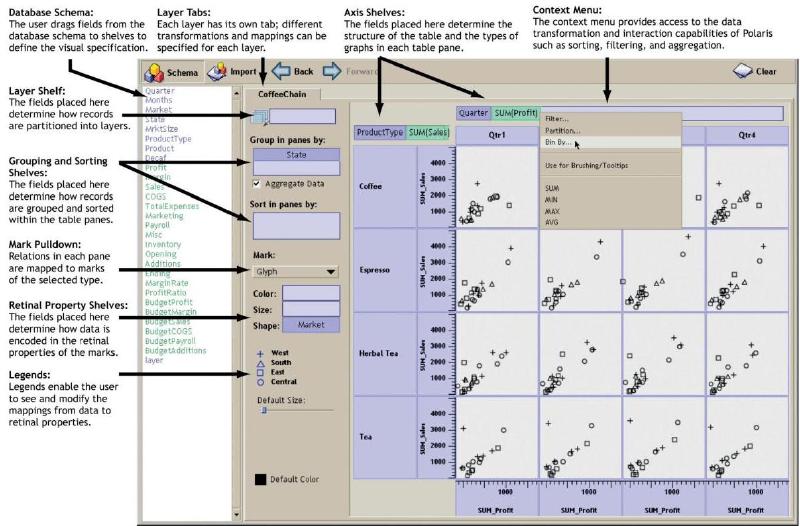
Polaris showed that visual exploration could be built on a formal grammar. Users could compose views by arranging fields, and the system could translate those visual arrangements into database queries. This made interaction, analysis, and visualization parts of the same process.
Design Lessons
- Visualization can be treated as a query language.
- Multidimensional data analysis benefits from a visual grammar.
- A good interface should connect field placement, aggregation, and rendering.
- The path from Polaris to Tableau shows how research can become production software.
Summary
Polaris is important because it reframed visualization as a structured analytical language. That idea directly influenced Tableau and remains central to how modern visual analytics tools connect data, queries, and interactive views.