All series
Articles gathered by theme, to be read in order. There are 5 series.
10 articles
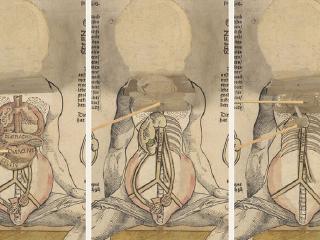
Classics of Data Visualization
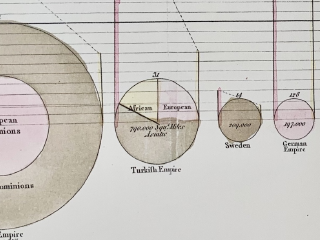
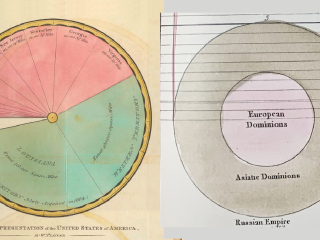
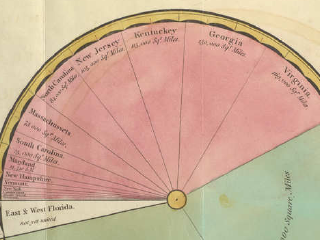
Playfair's pie charts, Minard's map, statistical bureaus' thematic maps, Tukey's paper. Reading the charts and ideas that shaped today's forms of visualization.
11 articles
Data Visualization × Journalism
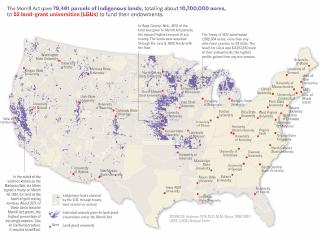
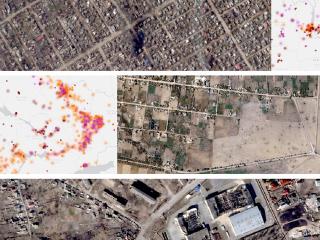
Reading reports entered for the Sigma Awards for data journalism, and a data-driven film, to learn how their visualizations were made: wind roses, satellite images, ship tracks, floods, heat, price maps, and stacked war dead.
4 articles
Data Visualization × Speculative Design
Reading works by Giorgia Lupi / Accurat and Superflux to see how they turn numbers into evidence people can feel.
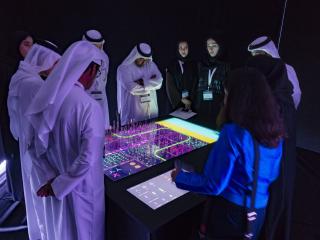
44 articles
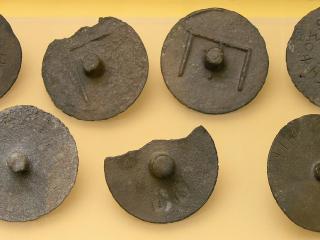
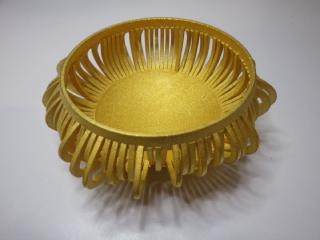
Data Physicalization
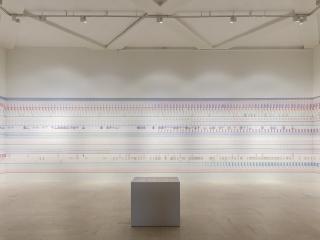
Knots, cubes, yarn, paper, beach trash, grains of rice, food. Reading cases that turned data into things you can touch, in chronological order, to learn how numbers are matched to materials.
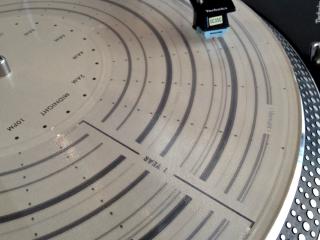
5 articles
Data Sonification
Reading works and tools that turn data into sound: which variables they assigned to pitch, duration, timbre, or the number of instruments, and what they left out of the data.