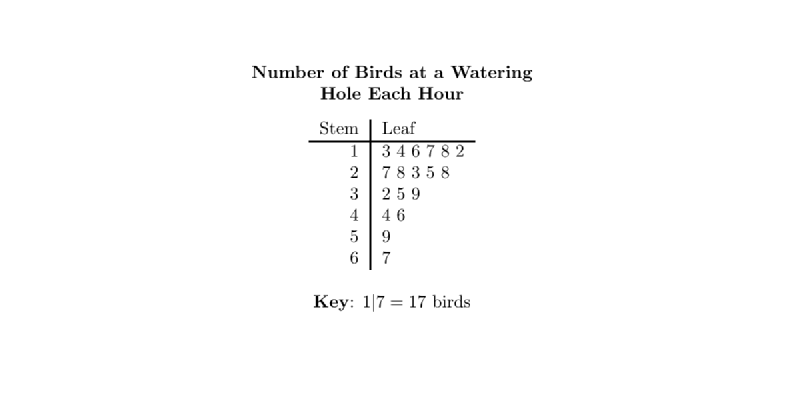
A stem-and-leaf plot splits numeric values into stems and leaves, preserving individual observations while showing the shape of the distribution. It resembles a histogram, but the original data values remain visible.
Historical Background
Stem-and-leaf plots were popularized by John W. Tukey as part of exploratory data analysis in the 1970s. They were designed as a quick, hand-drawn way to inspect distributions before computers were widely available.
How to Read It
The stem contains the leading digits, and each leaf contains the final digit or digits. The row length shows frequency, while the leaves preserve individual values.
Design Notes
- Use for small to medium datasets.
- Choose stem width carefully.
- Sort leaves for readability.
- Use histograms for larger datasets.
Summary
Stem-and-leaf plots are useful for teaching and exploratory analysis because they reveal distribution while keeping the raw values visible.