The Fallen of World War II is an 18-minute film that holds one human figure fixed at 1,000 deaths and restacks them by country, theater, and battle, turning roughly 70 million deaths into quantities that can be compared. Soldiers and civilians are counted separately. It starts with US soldiers, moves on to Europe and Asia, and ends by setting the war beside earlier wars and postwar conflicts.
The author is Neil Halloran, who released it in 2015. What follows draws on the official page, the English subtitles of the narration, the JavaScript of the browser version, and Vimeo’s public information. The awards and reception come from the Information is Beautiful Awards and press coverage.
May 2015: an 18-minute film that runs in the browser
According to the credits on the official page, Halloran himself is responsible for the script, direction, coding, and narration. Music and sound are by Andy Dollerson. The upload to Vimeo was on May 20, 2015. According to Technical.ly, the release was timed for Memorial Day (May 25).
The work comes in two versions. One is the browser-based “Interactive” version, drawn with three.js and WebGL. The other is a video version, which originally linked to Vimeo and now links to YouTube.

Source: Neil Halloran, The Fallen of World War II official page (image provided for sharing)
The running time differs by source.
| Source | How the running time is given |
|---|---|
| Vimeo public information (API) | 1,096 seconds (about 18 min 16 s) |
| Official page | “Across 18 minutes” |
| Information is Beautiful Awards description | “The 15-minute data visualization” |
| Open Culture (October 7, 2015) | “15 minute film” |
I could not confirm whether a separate 15-minute version existed.
Viewers were invited to pay an optional “ticket price” (suggested amount: $2.50). PhillyVoice reports, citing the author’s tally, that during the first million views 1,392 people paid a total of $8,620. The film reached 4 million views in two and a half weeks after release (Technical.ly). In autumn 2015, versions in seven languages, including Japanese, appeared (Japanese version).
Holding 1 figure = 1,000 people fixed through to the total
The narration opens by saying what the work is not about.
“This project is not about individual war stories, and it’s not about survivors. We are going to tally up the tens of millions of people whose lives were cut short by the war, and see how these numbers stack up to other wars in history, including trends in recent conflicts.”
It is a declaration that the film will not tell individual experiences or survivors’ stories, but will count the tens of millions whose lives were cut short and compare them with other wars.
Next it fixes the unit: “Each of these figures will represent 1000 people who died.” One human figure is 1,000 deaths. Because “casualty” is a word that also covers the wounded, the narration adds that only deaths are counted here.
The correspondence between data and visuals can be read from the subtitles and the work’s JS as follows.
| Data | Visual / mapping | Basis |
|---|---|---|
| 1,000 deaths | 1 human figure | Subtitles |
| Soldiers and civilians | Counted as separate figures in separate layers | Subtitles, JS |
| Military deaths by country | Vertical columns of stacked figures, starting with the US | Subtitles |
| Time | Figures rearranged along a horizontal timeline | Subtitles |
| Individual battles | Battle names on the timeline; touching one shows the country, death toll, and date | JS, HTML |
| About 20 wars in history | Bar chart, then converted to share of world population | Subtitles |
| Postwar battle deaths | Yearly bars colored by four categories, then divided by world population | Subtitles, JS |
Showing quantity through the number of pictograms is the same idea as the isotype chart. What stands out in this work is that the unit does not change from scene to scene, all the way to the total, as I read it. The column of US soldiers, Stalingrad, and the Holocaust are all counted at the same 1 figure = 1,000 people.
Restacking by country, theater, and battle
The counting starts with US soldiers. Deaths number over 400,000, and about a quarter were in the Pacific theater. Laid out along the timeline, the deaths turn out to be concentrated toward the end of the war.
The film then sets the numbers beside familiar ones. At Omaha Beach, 2,500 US soldiers died. The narration says this is nearly the same as US soldier deaths over 13 years in Afghanistan.
In Europe, countries are added one at a time. At Stalingrad, 500,000 German soldiers died. On the number of Soviet soldiers, the narration touches on how certain the figure is.
“8.7 million is the official tally by the Russian military, a hotly disputed number. Some studies have calculated as many as 14 million dead.”
The explanation is that the Russian military’s official tally is 8.7 million but is hotly disputed, and some studies put it as high as 14 million.
The film stops once it has laid the European military deaths along the timeline: “You can now interact with the chart to learn more.” The official page describes this design as “pauses at key moments.” The screen shows an “Interactive Mode” progress bar and a “Pause for more time” button.
Next come civilians. The 6 million Jewish victims of the Holocaust are regrouped by country and by place of killing. For the Roma, 130,000 to 500,000, it adds “The numbers are disputed.” Poland lost over 16% of its population, the largest share. In absolute numbers, the Soviet Union is higher.
European military and civilian deaths together exceed 40 million, and adding Asia brings the film to the total.
“When you add all the deaths outside of Europe, it brings us a grand total of 70 million for the war - give or take, depending on who’s counting, and what civilian deaths get included.”
The total is 70 million, with the caveat that it varies depending on who counts and which civilian deaths are included. By restacking the same figures along different cuts (country, theater, battle, place), the film lets viewers compare the total through its parts, as I read it.
The last chapter changes the denominator
After the total, the film lines up World War II with about 20 wars and massacres in history as a bar chart. Then it changes the scale.
“If we want to compare them in terms what percentage of the world died, we can adjust the chart like this. This rough approximation tells us that there may have been more devastating wars before WW2, proportionally speaking.”
The explanation is that, as a share of world population, there may have been wars larger than World War II. The same bars are shown again with a different denominator.
In the postwar chapter, the narration introduces the “Long Peace,” a term John Gaddis used in 1989. It divides postwar wars into four categories and sets yearly battle deaths beside those of World War II. Dividing further by world population, the narration says, makes the decline look even steeper.
How the data sources are described differs by material.
| Subject | Material | What it says |
|---|---|---|
| World War II deaths | Official page | Sources close to those listed in the English Wikipedia article “World War II casualties” |
| Postwar battle deaths | Official page | Uppsala Conflict Data Program (UCDP) |
| Postwar battle deaths | The work’s JS | The variable is named prioData. Values by conflict, 1946 to 2013 |
| Inspiration and source for the last chapter | Official page | Steven Pinker’s The Better Angels of Our Nature |
The name prioData can be read as a remnant of battle-death data from PRIO (the Peace Research Institute Oslo). But I could not confirm which dataset or which edition it is. The work itself does not give sources for individual figures either.
The narration holds back from guessing at causes: “This isn’t to infer anything about why this trend is occurring.” It closes with “Of course this trend may not continue.” and then continues:
“But the longer the long peace grows, the more significant it becomes.”
The closing line says that the longer the long peace lasts, the more significant it becomes.
How third parties saw the work
The assessments each point to a different aspect. The first concerns the film’s storytelling. The Information is Beautiful Awards 2015 gave it Gold in the Motion infographic category.
“The 15-minute data visualization uses cinematic storytelling techniques to provide viewers with a fresh and dramatic perspective of a pivotal moment in history.”
The assessment is that it used techniques of cinematic storytelling to give a fresh view of history.
The second is an experience that goes beyond passive viewing. The work received the SXSW Interactive Innovation Award in 2016. According to PhillyVoice, this award honors experiences that “move beyond passive viewership.” The design that pauses and lets viewers touch the chart can be read as fitting that description.
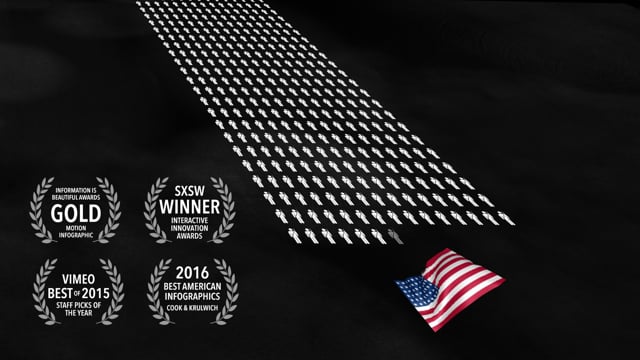
Source: Neil Halloran, Vimeo (video thumbnail)
The thumbnail carries four badges. Of these, I have not verified two, Vimeo and Best American Infographics, against the awarding bodies’ own materials.
The third is the author of the book the last chapter draws on. Technical.ly quotes a post by Pinker from May 31, 2015.
“Can data be emotionally gripping, visually stunning, world-view-changing? Don’t miss @neilhalloran ’s Fallen of WWII”
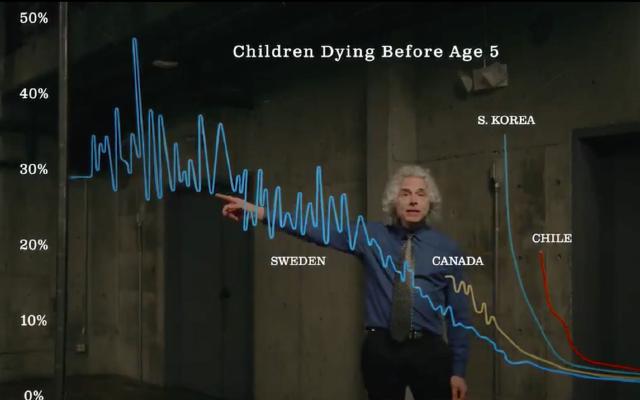
It is a recommendation: can data grip the emotions and change how we see the world? Don’t miss it. Pinker’s way of presenting data was also read in the article on glowing line charts.
The fourth is criticism. But it is not criticism of the work’s figures. It targets the premise of the “Long Peace” argument that the last chapter relies on. Pasquale Cirillo and Nassim Nicholas Taleb published a paper in May 2015. Applying extreme value theory to conflicts over the past 2,000 years, they argue that deaths follow a heavy-tailed distribution and that the true mean is considerably larger than the sample mean.
“We study inter-arrival times between tail events and find that no particular trend can be asserted. All the statistical pictures obtained are at variance with the prevailing claims about “long peace”, namely that violence has been declining over time.”
Their conclusion is that no trend can be asserted in the intervals between large wars, and that this conflicts with the claim that violence has declined.
The paper does not dispute individual counts such as how many Soviet soldiers died. What it disputes is the premise that a decline can be claimed from several decades of postwar observation. The work’s closing line can be read as colliding with the paper on this point. Pinker has published a rebuttal, but I have not read its text for this article. I did not find any critique that names the sources of the work’s death figures as a problem.
Takeaways
There are four judgments to take back to visualization work.
First, fix one unit and do not change it through to the total. Because 1 figure = 1,000 people was carried through to the total, columns from different scenes can be compared by eye. Minard’s map likewise carried 1 mm = 10,000 men across its two armies.
Second, restack the parts before showing the total. The film does not show 70 million at once; it adds up by changing the cut. It also slips in comparisons with familiar numbers, like Omaha Beach and Afghanistan.
Third, say so when a number changes depending on how it is counted. The narration itself states the ranges for Soviet soldiers, the Roma, and the total. But the work gives no source for each number. Had a list been placed outside the work, I read it as something people who wanted to check could have followed.
Fourth, keep in mind that the choice of denominator and period is also a claim. The work itself showed death counts and population shares side by side. On the other hand, whether a decline can be claimed from about 70 postwar years is exactly what Cirillo and Taleb contested. Depending on which denominator you divide by and how far the period reaches, the story of the same bar changes, as I read it.
References
Primary sources
- Neil Halloran, The Fallen of World War II, 2015. Official page. fallen.io/ww2 (canonical URL: neilfilms.com/ww2). It cites Steven Pinker’s The Better Angels of Our Nature as the inspiration and source for the last chapter
- Same, Japanese version. neilfilms.com/ww2/ja
- Same, English subtitles (full narration). en.vtt. The statement that John Gaddis named the “Long Peace” in 1989 comes from these subtitles
- Same, the work’s JavaScript (data and scene definitions). ww2-1462503229819.js
- Neil Halloran’s site. neilfilms.com
- Vimeo (author’s description, running time, upload date). Video page / API
- YouTube. Video page
- Data sources the work indicates: English Wikipedia, “World War II casualties”. Wikipedia / Uppsala Conflict Data Program. UCDP
Secondary sources
- Information is Beautiful Awards 2015 (Gold, Motion infographic category). Showcase page
- PhillyVoice, 2016-03-20 (SXSW award; tally of views and payments). Article
- Technical.ly, June 2015 (views, WebGL, Pinker’s post). Article
- Technical.ly (SXSW award). Article
- Open Culture, 2015-10-07 (seven-language versions). Article
- Pasquale Cirillo and Nassim Nicholas Taleb, “On the statistical properties and tail risk of violent conflicts,” arXiv:1505.04722, 2015. arXiv
- Steven Pinker’s reply to Cirillo and Taleb (PDF; not read for this article). PDF