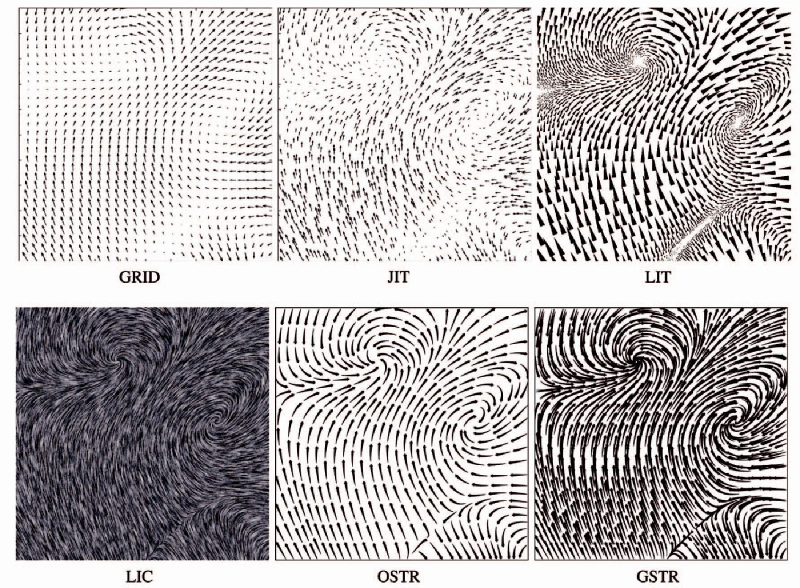
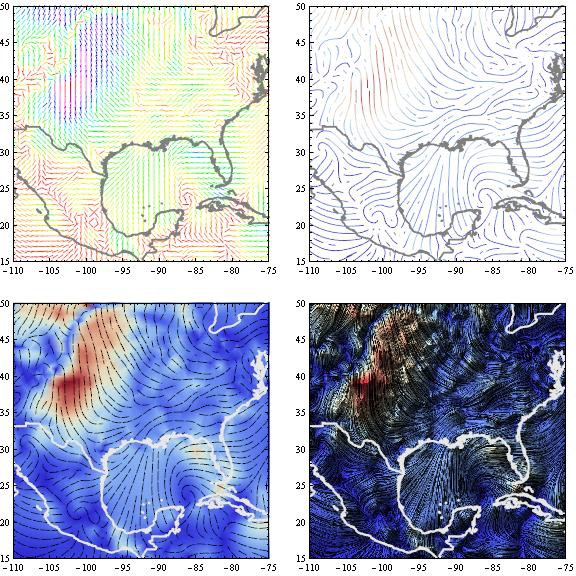
A vector field map shows direction and magnitude at spatial locations using arrows or glyphs. It is used for data such as wind, ocean currents, electric fields, and magnetic fields. Arrow angle represents direction, while length or color represents strength.
Historical Background
Vector field visualization developed with physics and fluid dynamics. Michael Faraday’s field-line diagrams and James Clerk Maxwell’s mathematical work on fields helped establish visual and mathematical thinking about directional forces. Modern weather and ocean maps now routinely use vector field visualization.
Data Structure
| Data | Role |
|---|---|
| Location | Point where vector is measured |
| Direction | Arrow angle |
| Magnitude | Arrow length or color |
| Optional time | Animation or temporal comparison |
Design Notes
- Avoid drawing too many arrows.
- Use consistent scaling for magnitude.
- Consider streamlines for dense flow.
- Use animation carefully for time-varying fields.
- Include a legend for arrow length or color.
Summary
Vector field maps are effective for directional spatial data. They help readers see flow, force, or movement patterns, but density and scaling must be managed carefully.