A Venn diagram visualizes relationships between sets. Circles or closed curves represent sets, and their overlaps represent shared elements. Venn diagrams are used in logic, probability, set theory, education, data analysis, and business communication to make inclusion and exclusion relationships easy to understand.
Historical Background
The Venn diagram was formalized by the British logician John Venn (1834-1923) in 1880. His paper “On the Diagrammatic and Mechanical Representation of Propositions and Reasonings” presented a systematic way to show set relationships.
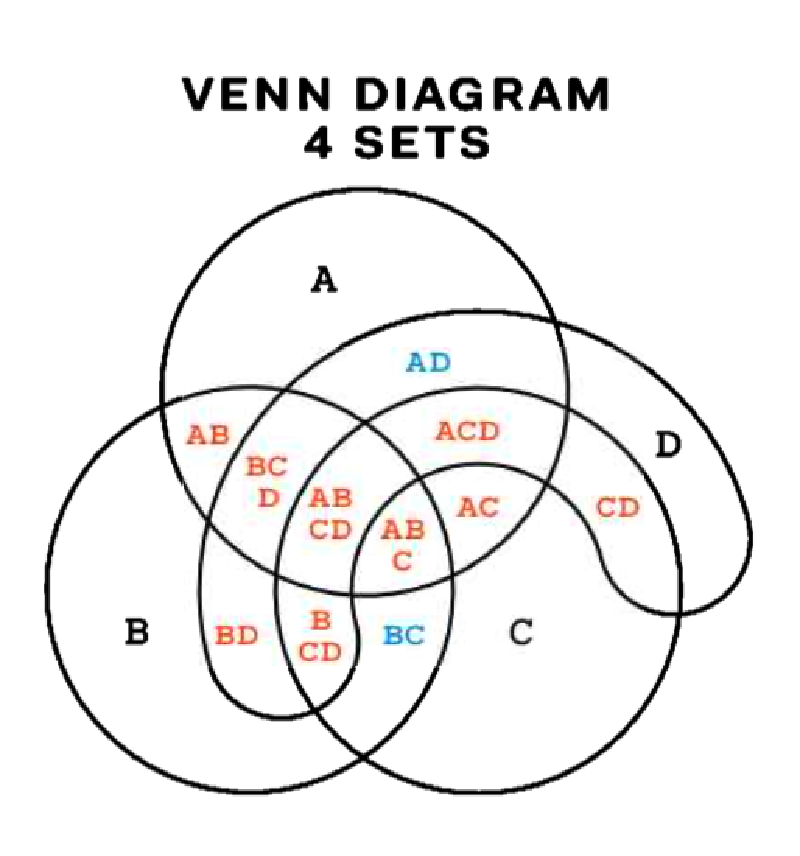
Earlier diagrams by Leonhard Euler also represented set relationships, but Euler diagrams show only relationships that actually exist. Venn diagrams differ by including all logical possibilities, or 2^n regions for n sets.
Data Structure
| Element | Meaning |
|---|---|
| Set | A group represented by a circle or closed curve |
| Element | An item belonging to one or more sets |
| Intersection | Elements shared by multiple sets |
| Exclusive region | Elements belonging only to one set |
Purpose
The purpose of a Venn diagram is to show similarities, differences, intersections, and exclusions among a small number of sets. It is especially effective for two or three sets and is widely used as a thinking and teaching tool.
Use Cases
- logic and set theory
- probability explanation
- customer or audience segmentation
- comparison of categories in data analysis
- classroom exercises for similarities and differences
How to Read It
- Each circle is a set.
- Overlapping areas show shared elements.
- Non-overlapping areas show elements unique to one set.
- In a three-set Venn diagram, the central overlap contains elements shared by all three sets.
| Symbol | Meaning | Position |
|---|---|---|
A, B | Sets | Circles or closed regions |
A ∪ B | Union | All parts of both circles |
A ∩ B | Intersection | Overlapping area |
A - B | Difference | Area in A but not B |
A^c | Complement | Everything outside A |
Design Notes
- Use color and transparency so overlaps remain visible.
- Place labels carefully to avoid obscuring intersections.
- Avoid using Venn diagrams for precise quantitative area comparison unless the geometry is explicitly constructed for that purpose.
- For many sets, consider Euler diagrams or UpSet plots.
Venn Diagram vs. Euler Diagram
| Item | Venn diagram | Euler diagram |
|---|---|---|
| Main idea | Shows all logical possibilities | Shows only actual relationships |
| Regions | 2^n possible regions | Only needed regions |
| Best for | Logic and theoretical explanation | Real-world classification |
| Shape | Usually circles or closed curves | Any clear closed curve |
Summary
The Venn diagram is a foundational visual method for explaining relationships between sets and concepts. Its simple shape carries a rigorous idea: all possible logical combinations are represented, whether or not every region contains elements.