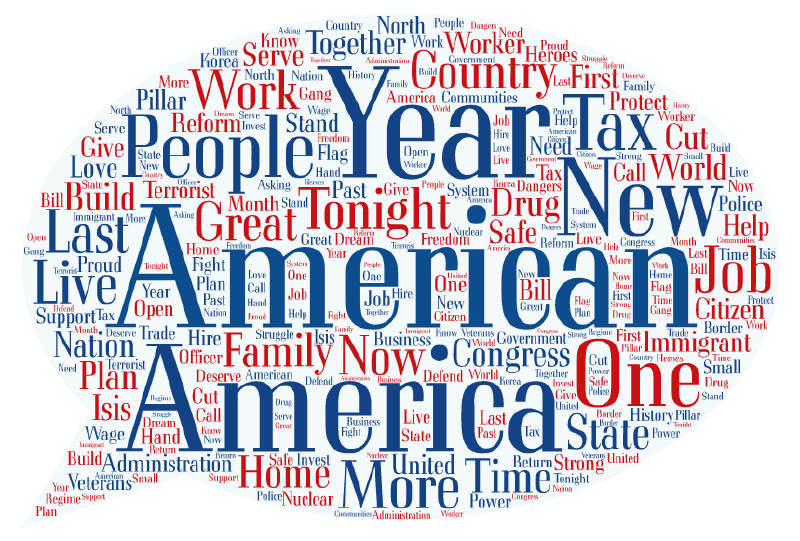
A word cloud visualizes words from text data by changing font size, color, or placement according to frequency or importance. It is often used to give a quick impression of documents, social media posts, survey responses, and other text collections. Larger words usually indicate higher frequency or importance.
Historical Background
Word clouds grew from tag clouds, which became common on blogs and web services in the early 2000s. Tag clouds displayed tags according to frequency. Later, natural language processing and visualization tools extended the idea to words extracted from arbitrary text.
IBM’s Wordle, created by Jonathan Feinberg in 2008, helped popularize the modern word cloud.
Data Structure
| Data | Role |
|---|---|
| Word | Text to display |
| Frequency or score | Determines size |
| Category or sentiment | Optional color grouping |
Purpose
The purpose is to provide a quick visual summary of prominent terms. It is useful for exploratory or communicative contexts, but it is not ideal for precise comparison.
Design Notes
- Remove stop words and irrelevant terms.
- Avoid showing too many words.
- Use color with meaning, not only decoration.
- Do not overclaim precise quantitative findings from layout.
- Consider bar charts when exact ranking matters.
Summary
Word clouds are accessible and memorable, but they are approximate. They work best as an entry point into text data rather than as a precise analytical chart.