Home
/
/
Posts
/
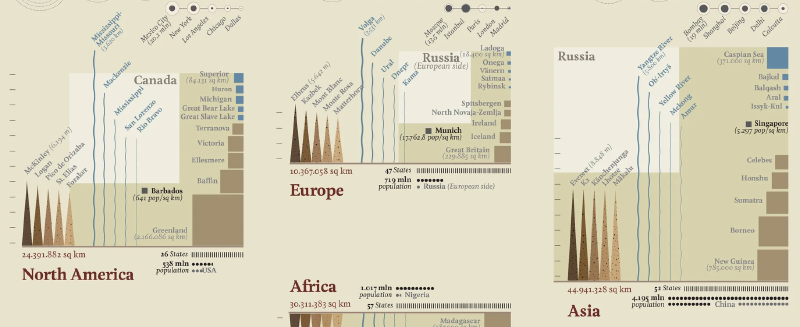
もし世界の大陸を同じスケールで描いたら?
見るための記事
もし世界の大陸を同じスケールで描いたら?
Home
/
/
Posts
/
時間‐距離図(Time-Distance Diagram)
チャート・カタログ
時間‐距離図(Time-Distance Diagram)
Home
/
/
Posts
/
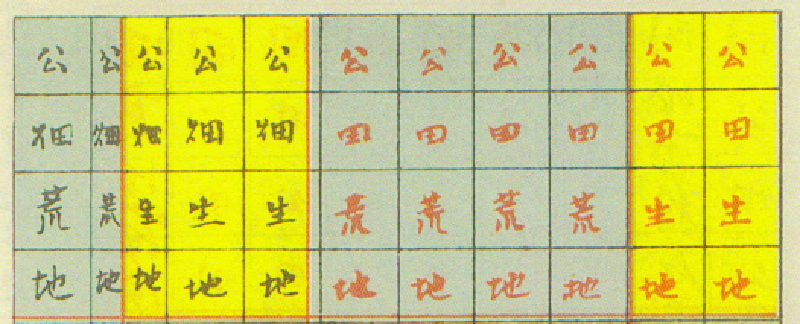
二宮尊徳と「土地分類」の思想
見るための記事
二宮尊徳と「土地分類」の思想
Home
/
/
Posts
/
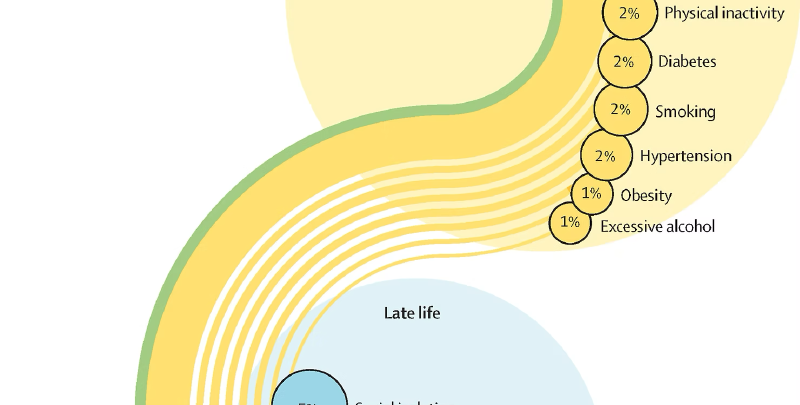
認知症リスクの45%は予防可能:ライフステージ別リスク要因の可視化
見るための記事
認知症リスクの45%は予防可能:ライフステージ別リスク要因の可視化
Home
/
/
Posts
/
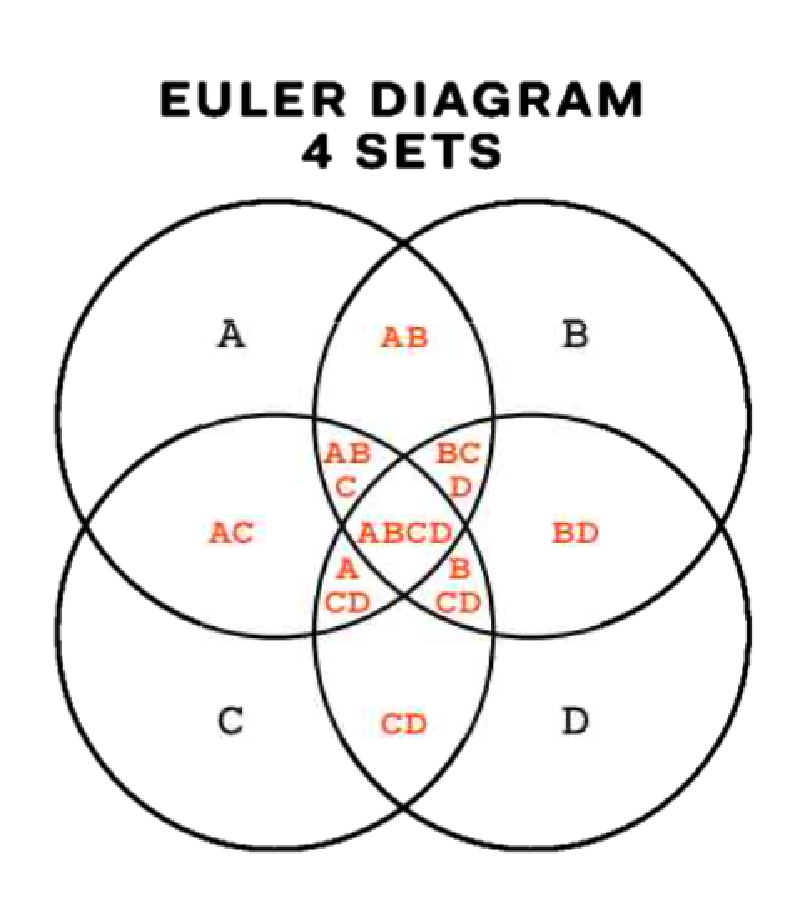
オイラー図(Euler Diagram)
チャート・カタログ
オイラー図(Euler Diagram)
Home
/
/
Posts
/
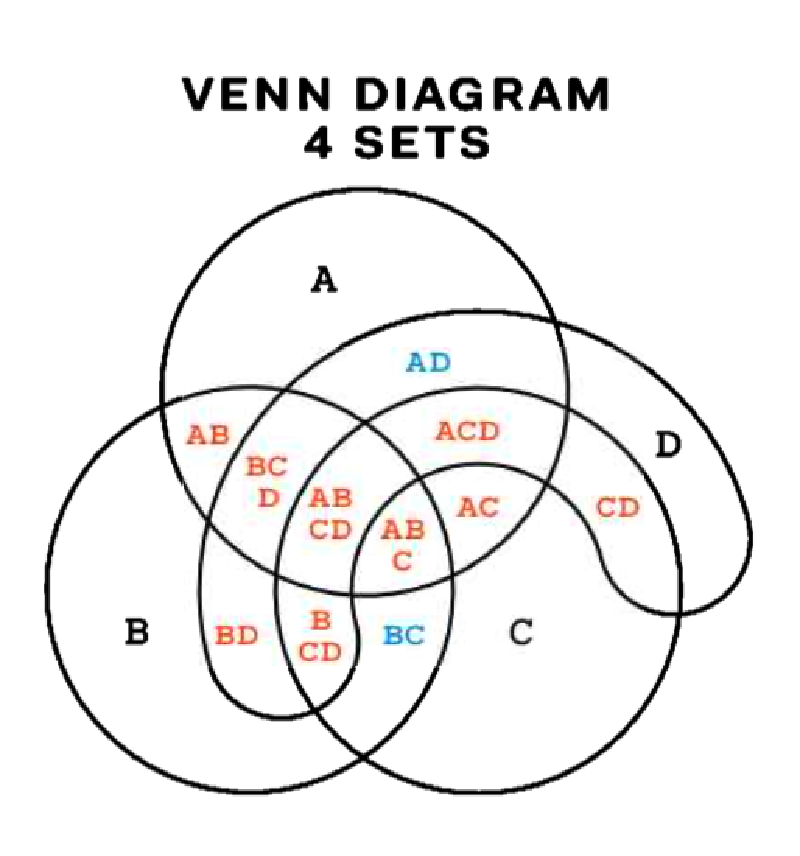
ベン図(Venn Diagram)
チャート・カタログ
ベン図(Venn Diagram)
Home
/
/
Posts
/
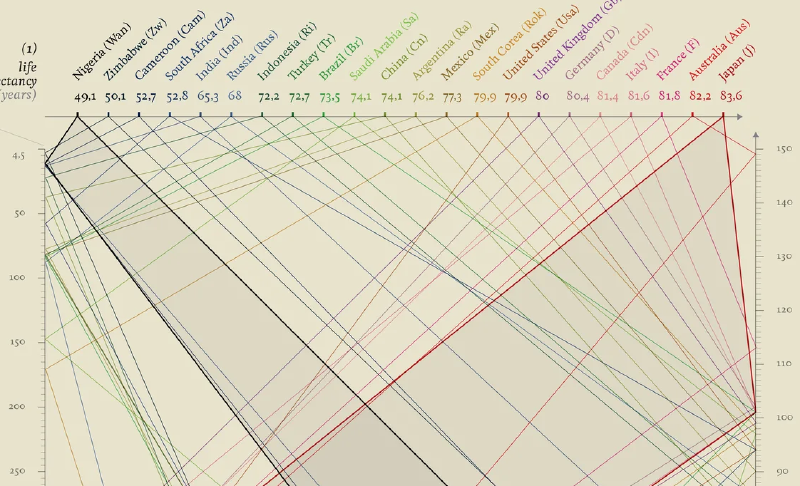
学びと寿命のあいだ - 教育水準と社会構造の相関を描く
見るための記事
学びと寿命のあいだ - 教育水準と社会構造の相関を描く
Home
/
/
Posts
/
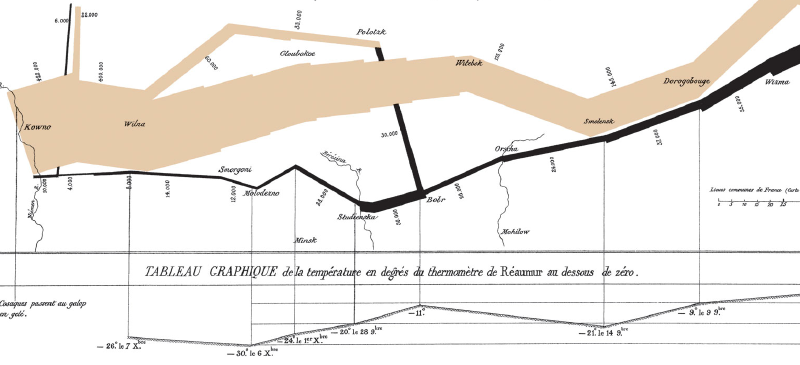
ナポレオンのロシア遠征を描いたミナールの「損耗の地図」
見るための記事
ナポレオンのロシア遠征を描いたミナールの「損耗の地図」
Home
/
/
Posts
/
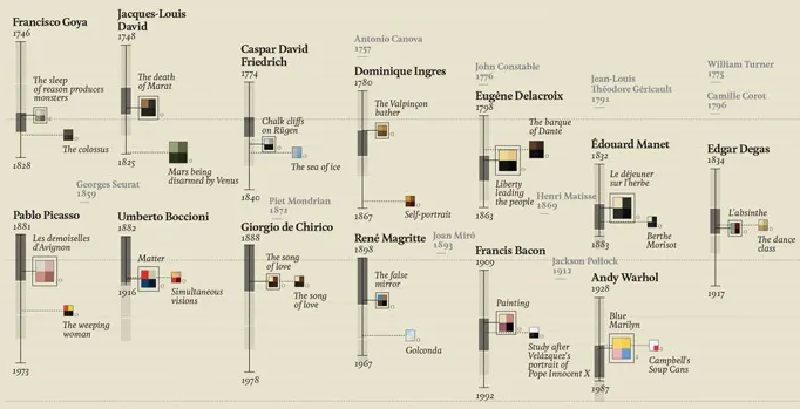
画家たちの人生と代表作
見るための記事
画家たちの人生と代表作
Home
/
/
Posts
/
学位のない天才たちを可視化する
見るための記事
学位のない天才たちを可視化する
1
…
10
11
12
…
28