トップ
/
/
Posts
/
100%積み上げ棒グラフ(100% Stacked Bar Chart)
チャート・カタログ
100%積み上げ棒グラフ(100% Stacked Bar Chart)
トップ
/
/
Posts
/
ADS-Bとは
作るための記事
ADS-Bとは
トップ
/
/
Posts
/
AISとは
作るための記事
AISとは
トップ
/
/
Posts
/
積み重ね棒グラフ(Stacked Bar Chart)
チャート・カタログ
積み重ね棒グラフ(Stacked Bar Chart)
トップ
/
/
Posts
/
グループ棒グラフ(Grouped Bar Chart)
チャート・カタログ
グループ棒グラフ(Grouped Bar Chart)
トップ
/
/
Posts
/
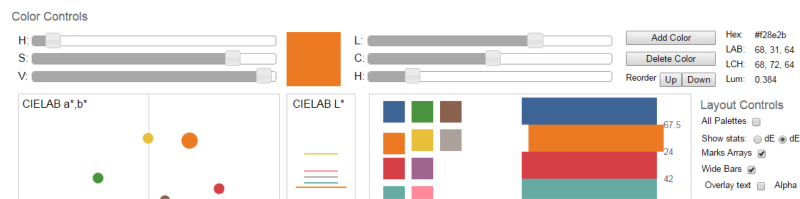
Tableauのカラースキーム進化史
作るための記事
Tableauのカラースキーム進化史
トップ
/
/
Posts
/
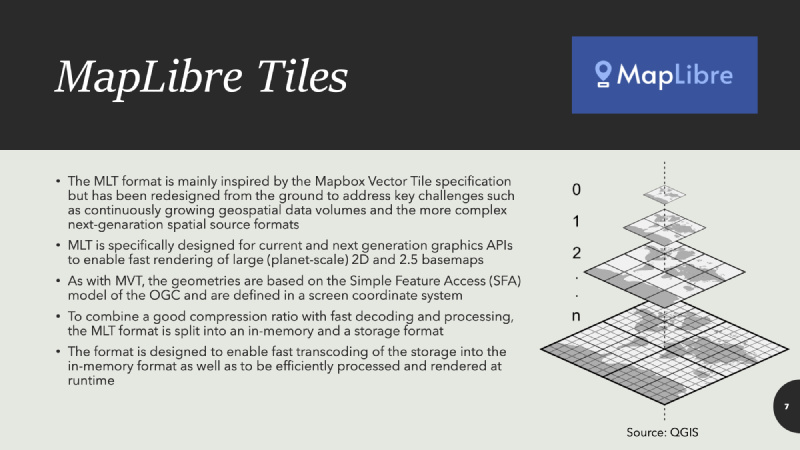
MapLibre Tile(MLT)とは
チャート・カタログ
MapLibre Tile(MLT)とは
トップ
/
/
Posts
/
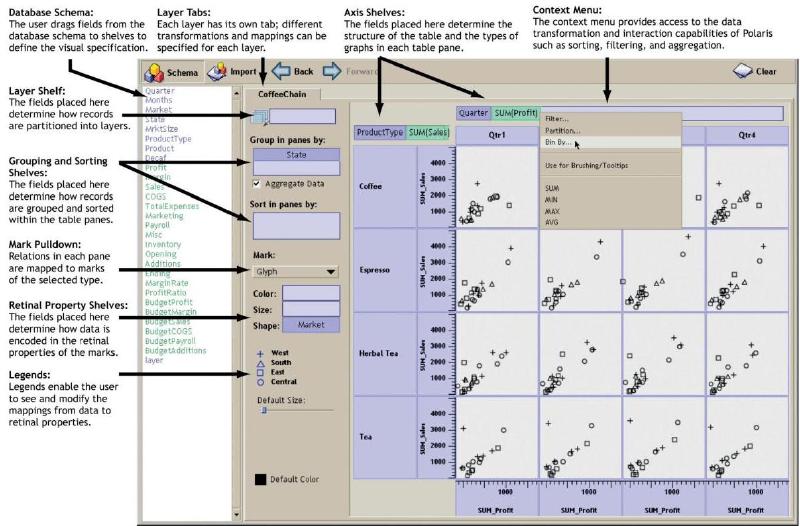
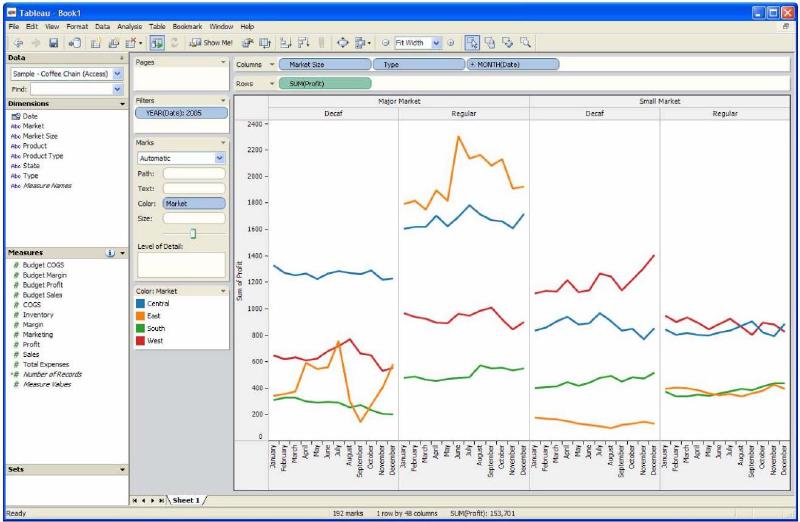
Polarisとは何か
見るための記事
Polarisとは何か
トップ
/
/
Posts
/
Show Meとは何か
見るための記事
Show Meとは何か
トップ
/
/
Posts
/
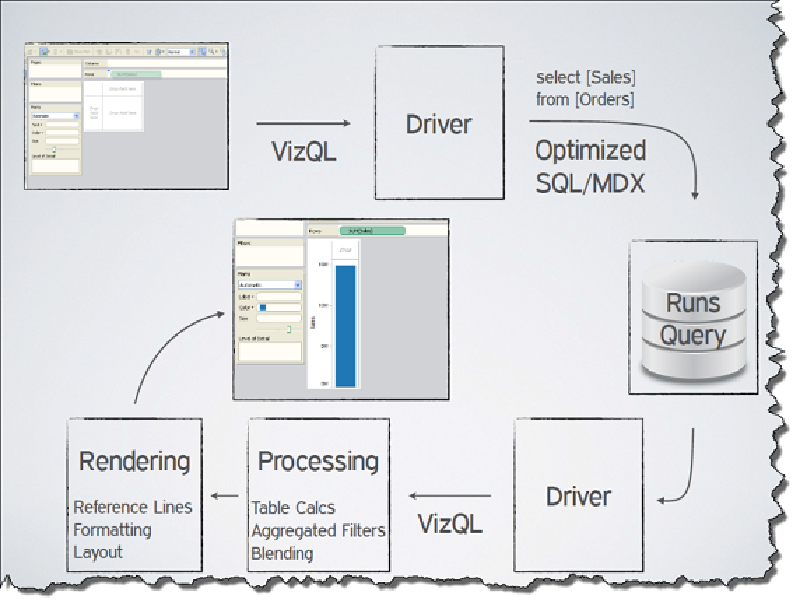
VizQLとは何か
見るための記事
VizQLとは何か
1
2
3
4
…
31