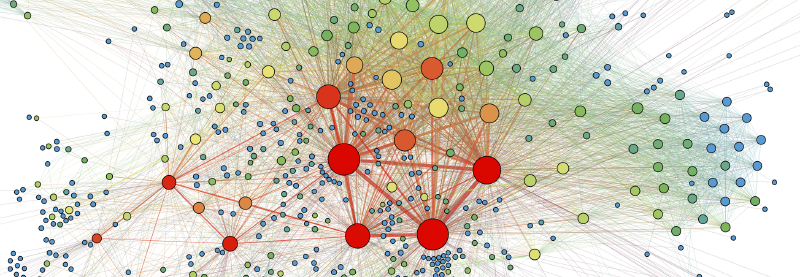
Avatar

Visualizing.JP

データ・ビジュアライゼーションにまつわる実践的な手法や実例を紹介しています。

  1. トップ
  2. 検索
  3. 記事一覧
  4. チャート・カタログ
  5. 見るための記事
  6. 作るための記事
  7. データ可視化の原理
  8. データ・ジャーナリズム
  9. イベント
  10. リンク
  11. このサイトについて

2023 3
2021 4
2020 75
2019 12
2018 2

technology chart consume data-journalism principle event dj

map 地図 d3-js qgis chart color covid-19 ia information-architecture network
Featured image of post サンバースト(Sunburst)
chart

サンバースト(Sunburst)

Aug 11, 2020
Featured image of post ディシメトリック・マップ(Dasymetric Map)
chart

ディシメトリック・マップ(Dasymetric Map)

Aug 11, 2020
Featured image of post ベクター・フィールド・マップ(Vector Field Map)
chart

ベクター・フィールド・マップ(Vector Field Map)

Aug 11, 2020
1 … 7 8 9 … 39
© 2013 - 2025 Yuichi Yazaki