
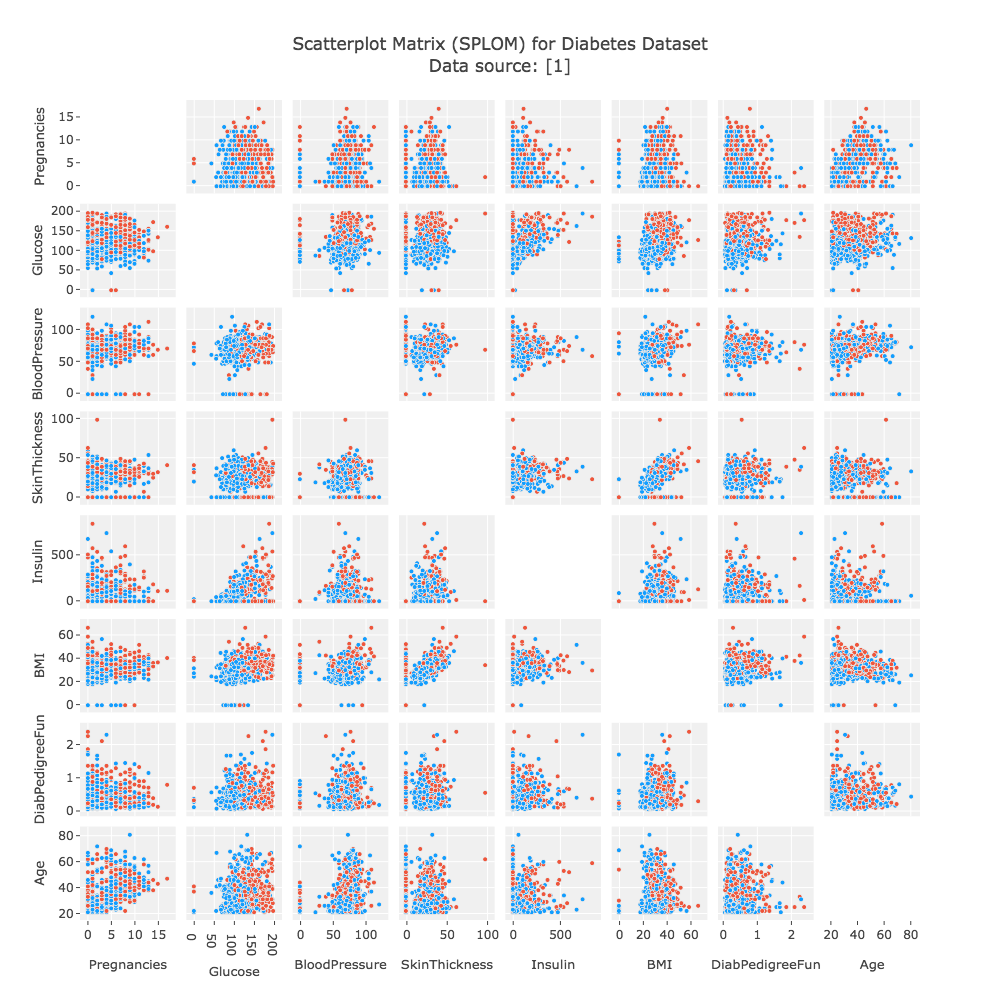
散布図行列(Scatterplot Matrix)は、多変量データの各変数間の関係を一度に視覚的に確認できる図表です。
縦軸と横軸に同じ変数群を並べ、行列状に散布図を配置することで、各変数ペア間の相関関係を俯瞰的に把握できます。
特にデータ探索(Exploratory Data Analysis, EDA)の初期段階で、異常値や傾向、線形・非線形の関係などを視覚的に発見するのに有効です。
チャートの見方
散布図行列では、行列の各セルが「2つの変数の関係」を表しています。 一般的な構成は以下の通りです。
| 位置 | 内容 | 解釈のポイント |
|---|---|---|
| 対角線上 | 各変数自身を示す(ヒストグラムやカーネル密度推定が置かれることも) | その変数の分布形状を把握する |
| 対角線より上・下 | 2変数間の散布図 | 点の傾き・広がりから相関関係を読み取る |
| 点の密集・傾き | 正・負の相関の傾向を示す | 線形関係の強さや外れ値の有無を観察できる |
| 色やサイズ(任意) | 第3の変数をエンコードする場合あり | 多次元的な関係を一枚で表現可能 |
また、プロットの上部と下部を非対称に設定することで、一方に相関係数(例えばPearson相関)や回帰線を併記することもあります。
背景と用途
この可視化手法は統計分析の分野で古くから用いられており、R言語のpairs()関数やPythonのseaborn.pairplot()などで簡便に生成できます。
多変量回帰分析や主成分分析の前処理として使われることが多く、次のような目的に活用されます。
- データの全体的な傾向・分布を確認する
- 強い相関関係のある変数を見つける
- 特定の変数間で外れ値やクラスター構造を見つける
- 特徴量選択(feature selection)の指針とする
また、次元数が多い場合は、主成分得点を用いた「縮約後の散布図行列」や「部分選択行列」を用いることもあります。
注意点
散布図行列は変数の数が多くなると、視覚的な過密や理解の困難さを招きます。
そのため、分析対象の変数をあらかじめ絞り込み、補助的にヒートマップや相関係数行列と併用するのが一般的です。
また、数値変数以外(カテゴリ変数など)は、形や色などで表現を工夫する必要があります。
まとめ
散布図行列は、多変量データの構造を直感的に理解するための強力な手法です。
単一の散布図では見逃されがちな相関構造や分布の偏りを、全体的に可視化できる点が大きな利点です。
ただし、変数数が多すぎる場合には可読性を損ねるため、選択的・補助的に利用することが重要です。