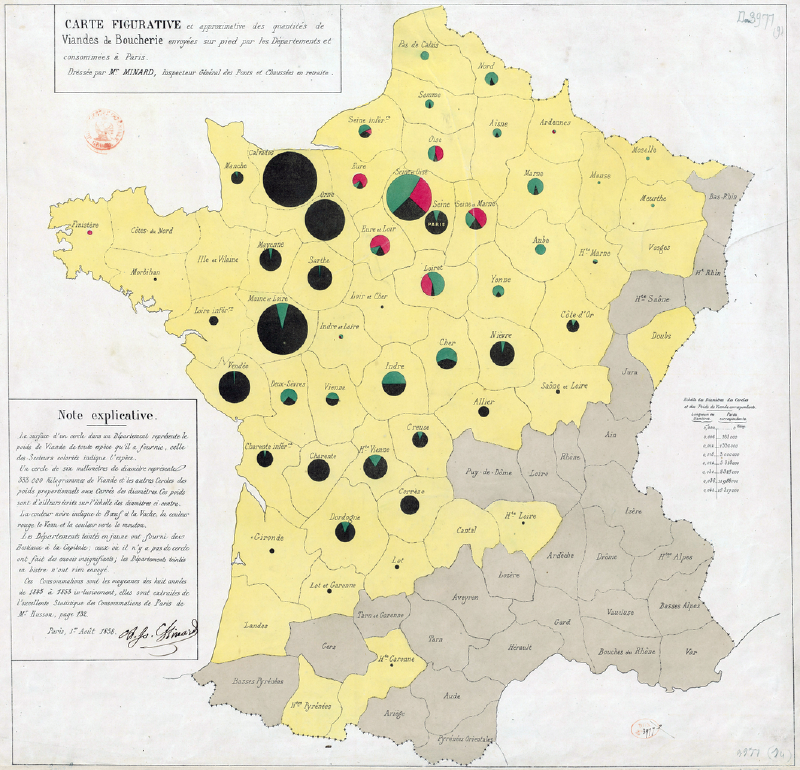
統計チャートを地図上に重ねて表示することで、地理的分布と統計的分析を同時に行うことを目指したものです。
配置が上手くいかないことがあったり、比較が困難であったりと、今となっては一般的には使用を推奨することはありません。
同様の意図を実現したい場合はスモール・マルチプルを利用することを検討してみてください。
作例
ナショナルアトラス(日本国勢地図帳) 国および都道府県の歳入
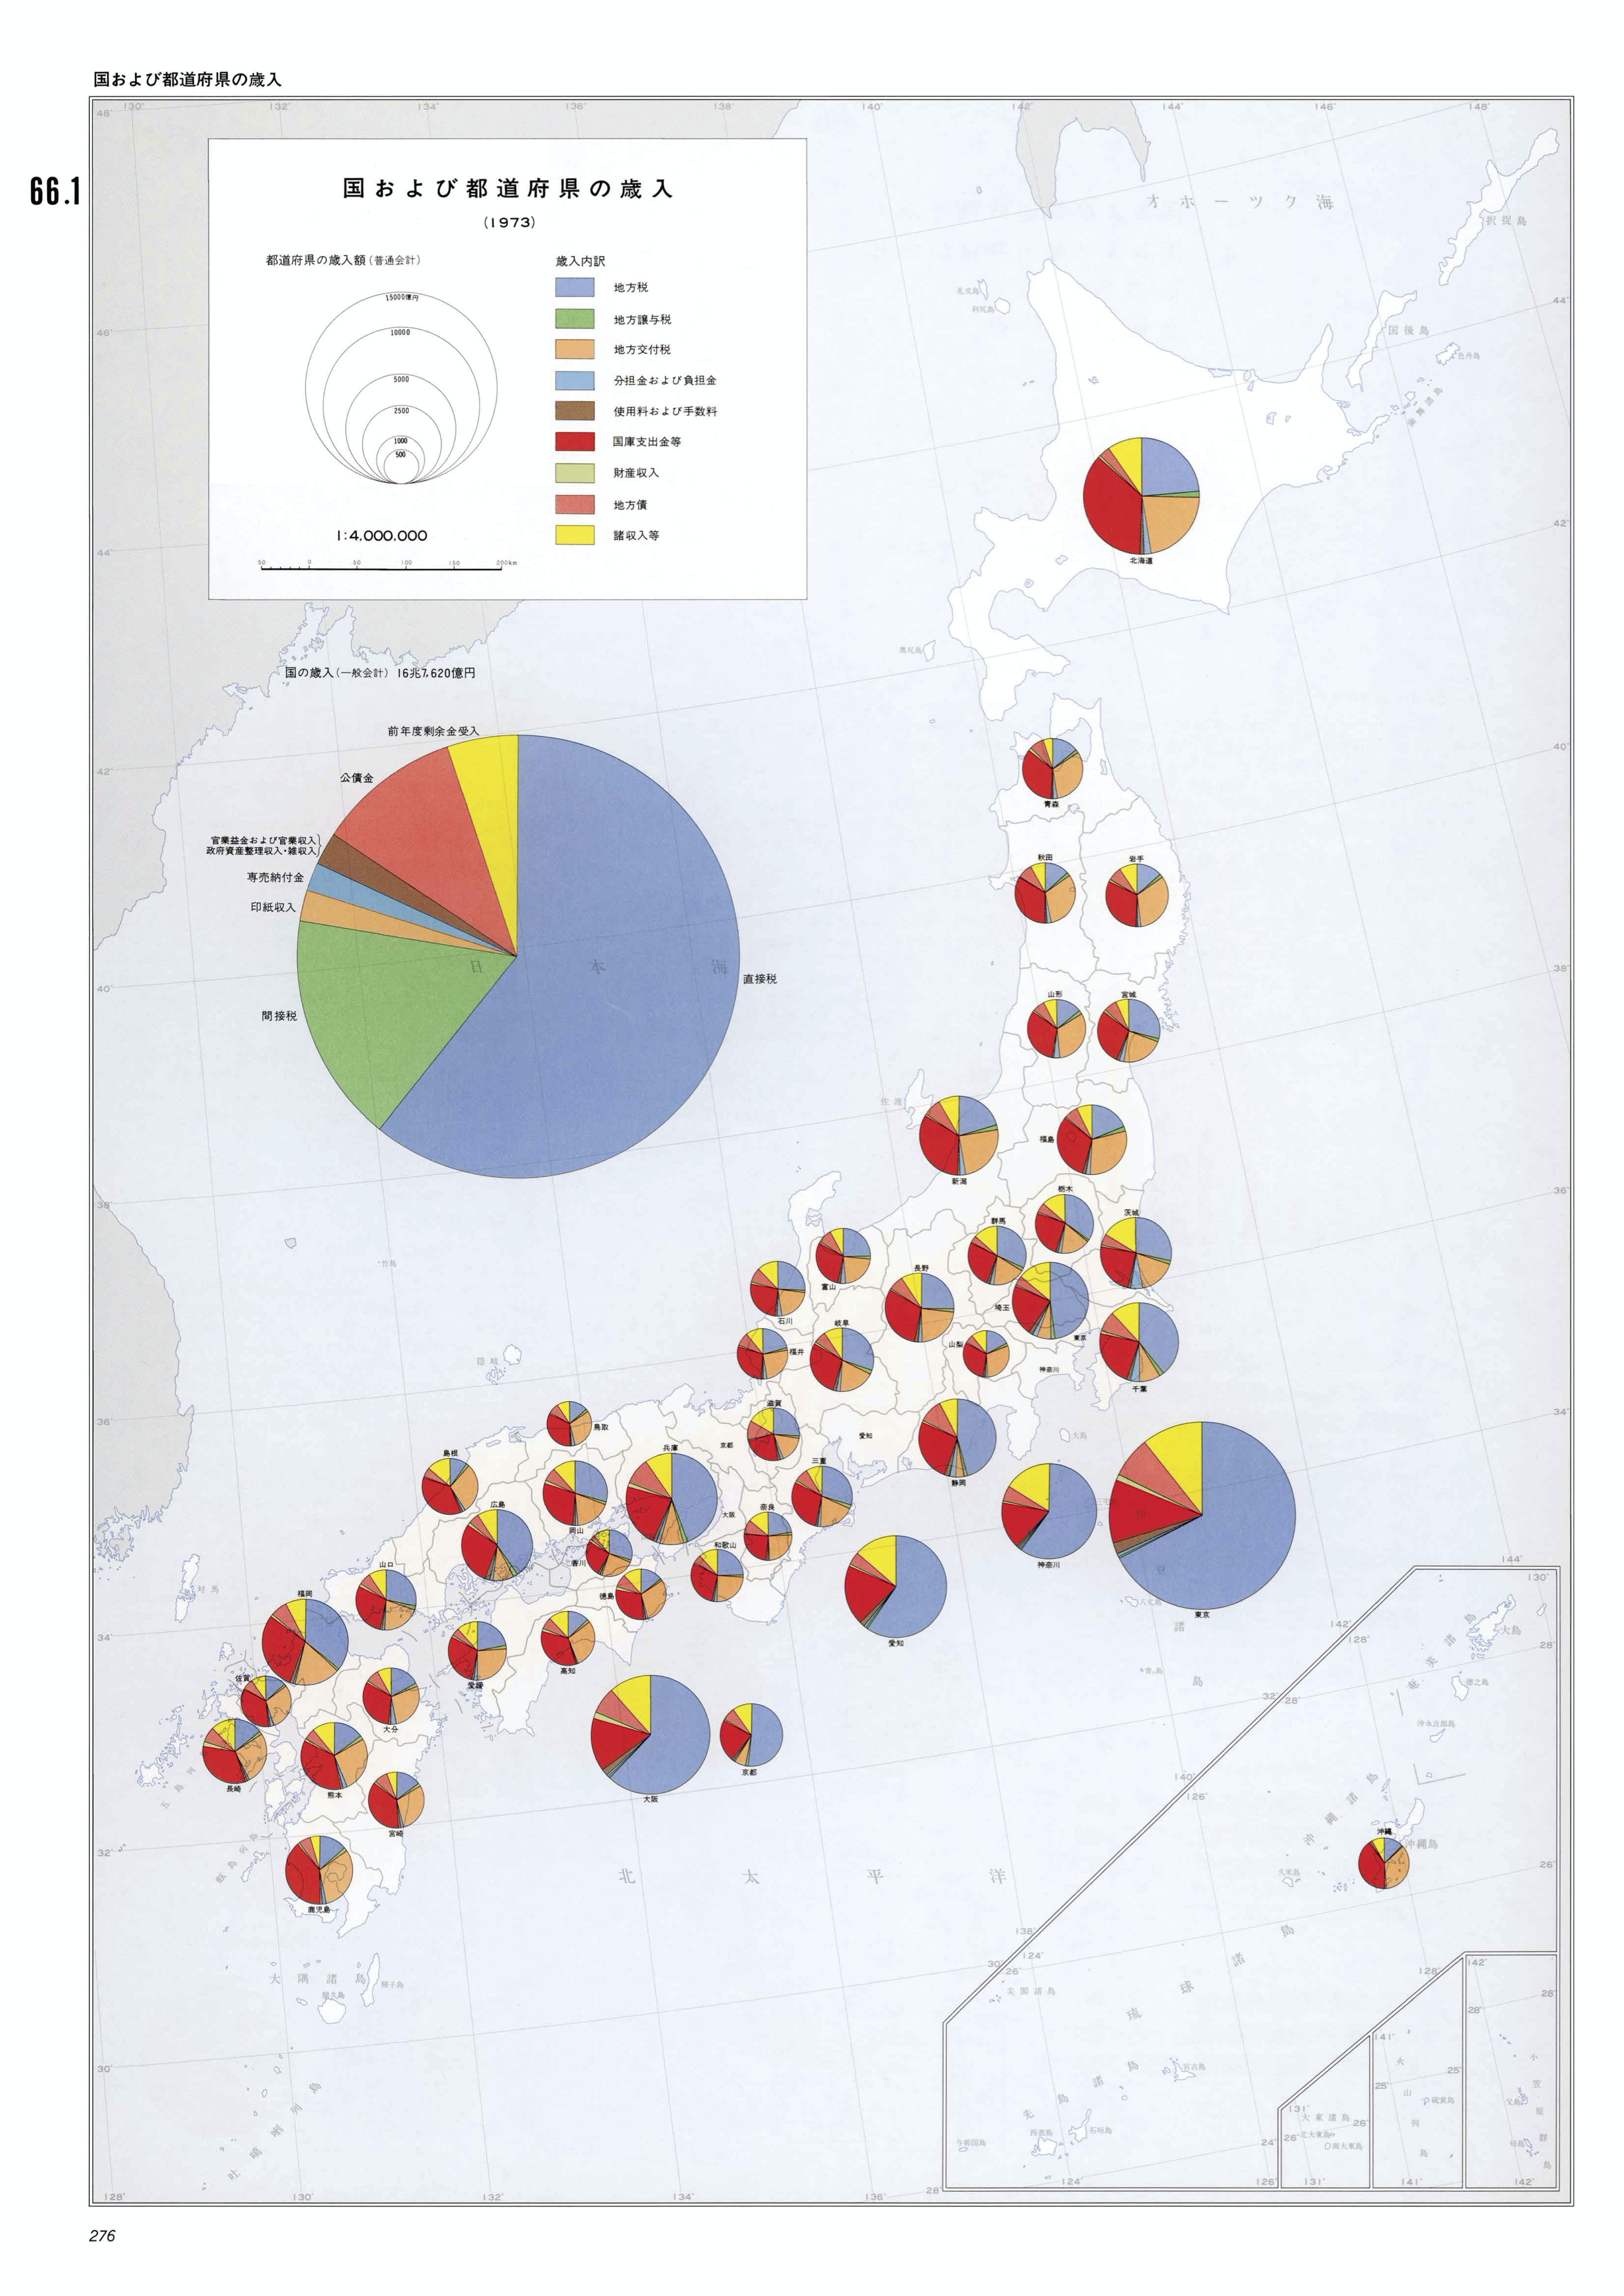
ナショナルアトラス(日本国勢地図帳) 国および都道府県の歳入
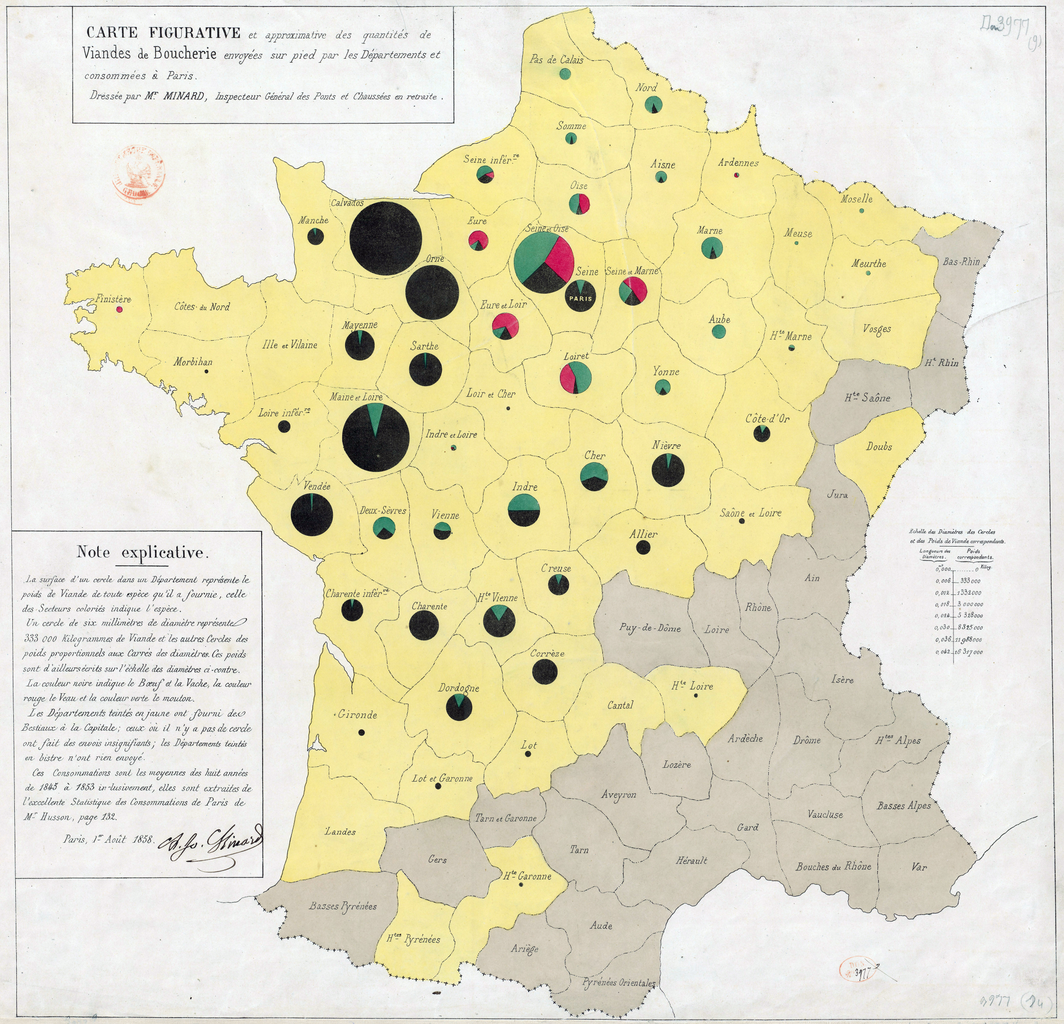
各地方からパリへ送られてくる食用牛肉の量
Pie Chart Map — Belfast
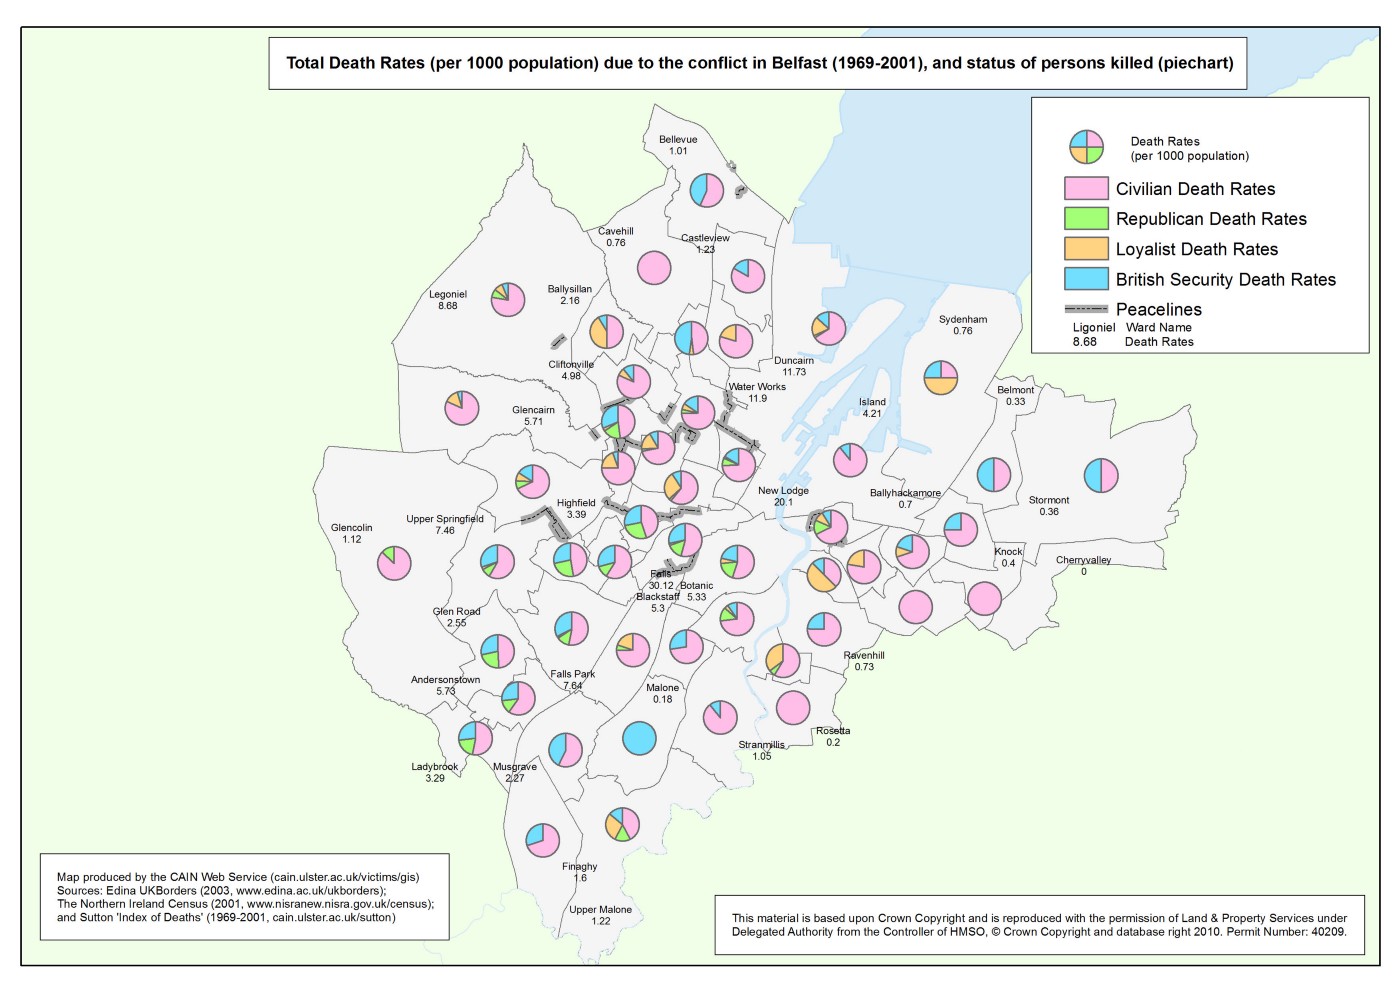
http://cain.ulst.ac.uk/victims/gis/maps/gismaps-16.html
Bar Chart on a Map — Tableau
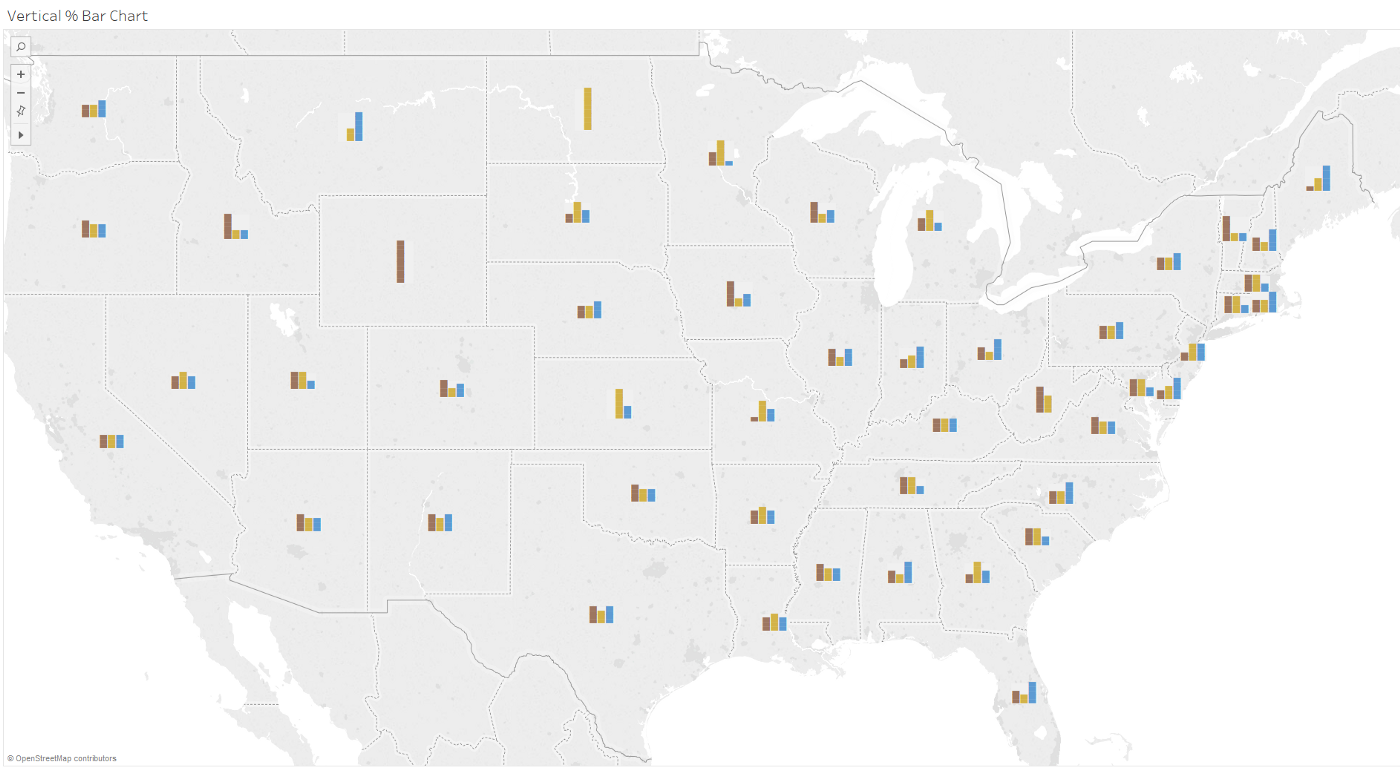
https://www.dataplusscience.com/BarChartMaps.html
Pie chart on a symbol map — Tableau
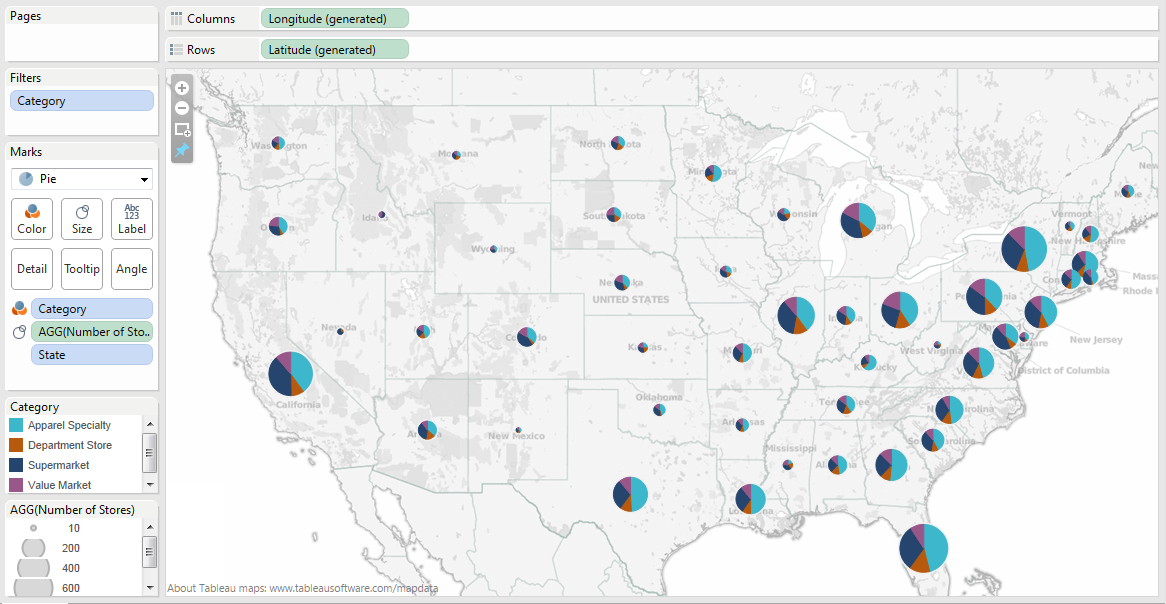
パイ・チャート・マップ(Pie Chart Map) — ArcGIS
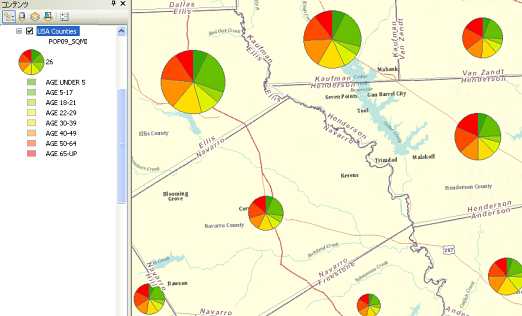
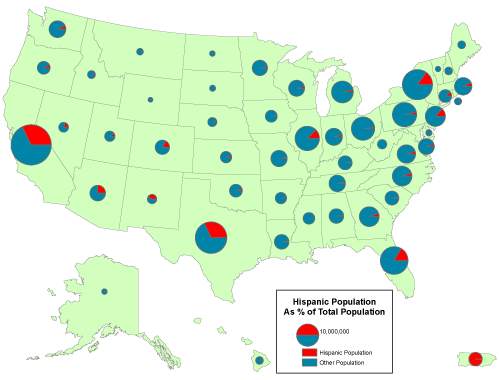
https://www.e-education.psu.edu/natureofgeoinfo/c3_p17.html
パイ・チャート・マップ(Pie Chart Map) — Coloremaps
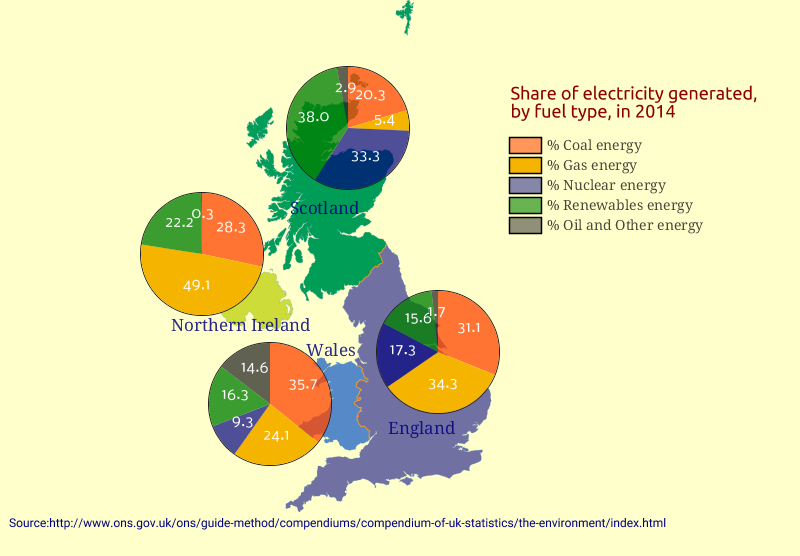
https://coloremaps.com/visualization-map-types/chart-maps/
100 biggest cities in 2010
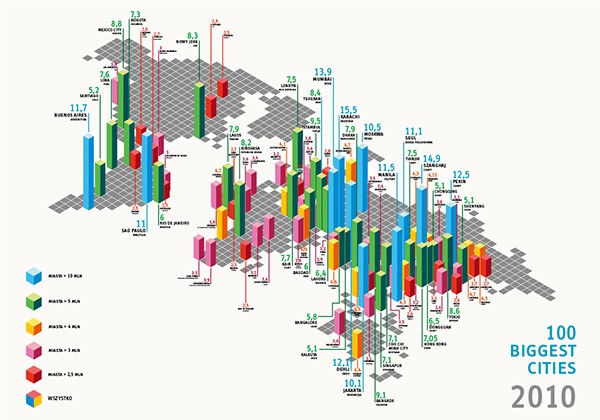
https://www.behance.net/gallery/4610471/100-biggest-cities-2010-infographic
コラム・チャート・マップ(Columns chart maps) — Coloremaps
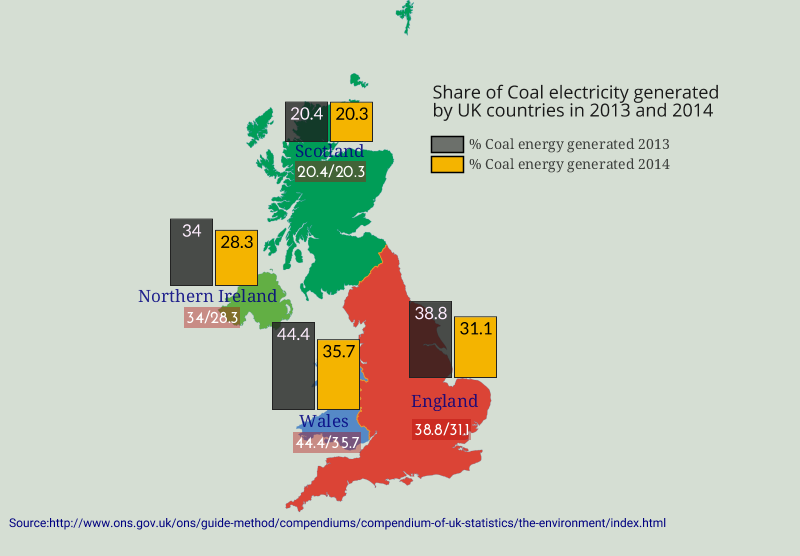
https://coloremaps.com/visualization-map-types/chart-maps/
参考文献
- 谷村 晋 (著), 金 明哲 (編集) — 地理空間データ分析 (Rで学ぶデータサイエンス 7)
