本文へ移動
Visualizing.JP

ストリームグラフ(Streamgraph)の事例

コロプレス・マップ(Choropleth Map)の事例を紹介します。

目次
  1. 01別名
  2. 02「映画の辺境と流れ:ボックスオフィスの領収書 1986–2008」
  3. 03Stream graph of the most-played music month-by-month
  4. 04What A Hundred Million Calls to 311 Reveal About New York
  5. 05年代・性別・人種別一日の過ごし方
  6. 06Euro 2012 Streamgraph B-sides
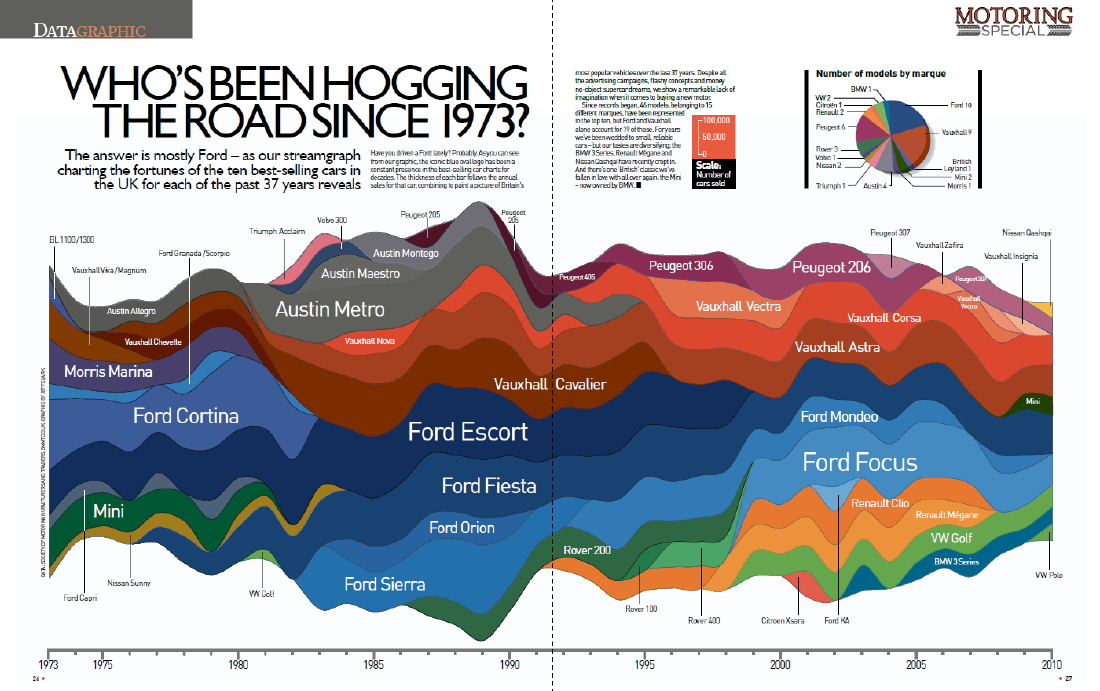
  7. 07Top Ten Cars in the UK
  8. 08ミームトラッキングとニュースサイクルのダイナミクス

コロプレス・マップ(Choropleth Map)の事例を紹介します。

別名

なし

「映画の辺境と流れ:ボックスオフィスの領収書 1986–2008」

The Ebb and Flow of Movies: Box Office Receipts 1986–2008

Stream graph of the most-played music month-by-month

Stream graph of the most-played music month-by-month

What A Hundred Million Calls to 311 Reveal About New York

What A Hundred Million Calls to 311 Reveal About New York

年代・性別・人種別一日の過ごし方

How Different Groups Spend Their Day

Euro 2012 Streamgraph B-sides

Euro 2012 Streamgraph B-sides

Top Ten Cars in the UK

Top Ten Cars in the UK

ミームトラッキングとニュースサイクルのダイナミクス

Meme-tracking and the Dynamics of the News Cycle

矢崎裕一 データ可視化の実務家
プロフィール

この記事は CC BY-NC-SA 4.0 で公開しています。